Chart Book (6th edition): Employment and Income – Standard Occupational Classification and Wage Estimates in Construction
Wages in the construction industry vary significantly by occupation and subsector. In 2015, construction managers earned more than 2.5 times the earnings of construction laborers on average ($46.29 versus $17.84; chart 25a). Similarly, workers employed in Nonresidential Building Construction (NAICS 263200, see page 1) earned an average annual wage of $60,570, compared to $42,280 for workers in Painting and Wall Covering (NAICS 238320; chart 25b). Even within the same occupation, wage rates differ by construction subsector. For example, the average hourly wage in 2015 for electricians in Heavy and Civil Engineering Construction was $29.82, 17% higher than that in the Construction of Buildings ($25.41; chart 25c). Wage differences may be associated with many factors, including work experience, unionization, demographics and region (see page 24), education (see page 29), and apprenticeship training (see page 30).
Wage data on this page were obtained from the Occupational Employment Statistics (OES) program, a cooperative effort of the U.S. Bureau of Labor Statistics (BLS) and state workforce agencies.1 The OES collects data from employers and provides wage and salary information for a larger range of occupations and geographical areas than other data sources. Like other establishment surveys, the OES classifies industries by the North American Industry Classification System (NAICS, see page 1), and occupations by the Standard Occupational Classification (SOC) system. Currently, the 2010 SOC is used by federal statistical agencies.2 Occupations are organized by six-digit numeric codes in the 2010 SOC. For example:
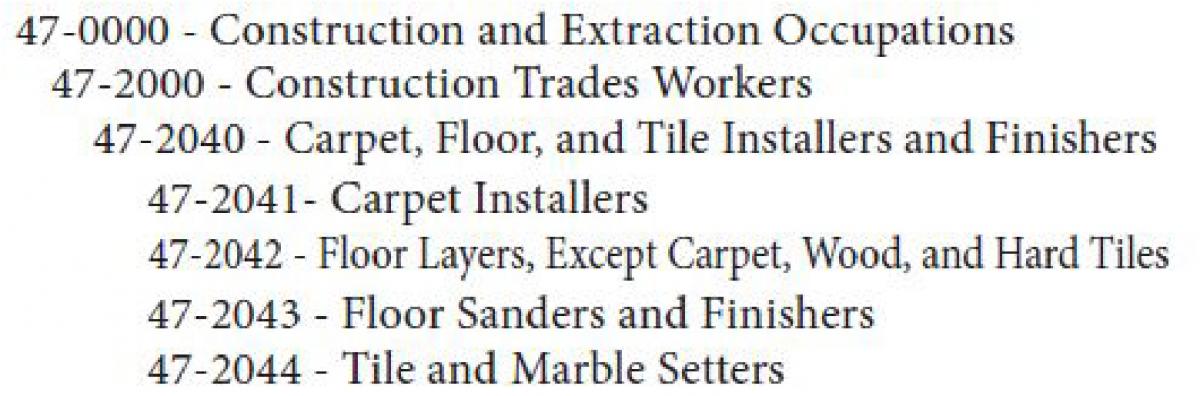
The first two digits of the SOC code represent the major group, the third digit refers to the minor group, the fourth and fifth digits indicate the broad occupation, and the sixth digit denotes the detailed occupation. The SOC is revised periodically to respond to changes in occupational structures due to new technology and the economic environment. The 2018 SOC codes have been proposed (with minor changes in construction occupations) and the revision process is ongoing.3
The OES data are based on a three-year average, including the year when data is released. The OES excludes self-employed workers and does not collect demographic data. Due to differences in survey methodologies, wage data reported on this page may differ from wage estimates in previous publications and on other pages in this chart book.
(Click on the image to enlarge or download PowerPoint or PDF versions below.)


1. U.S. Bureau of Labor Statistics. 2016. Occupational Employment Statistics overview. https://www.bls.gov/oes/oes_emp.htm (Accessed April 2016). OES national industry-specific data are available from http:www.bls.gov/oes/current/oessrci.htm (Accessed January 2017). OES data by state and metropolitan / nonmetropolitan area are available from https://www.bls.gov/oes/current/oessrcst.htm and http://www.bls.gov/oes/current/oessrcma.htm (Accessed January 2017).
2. U.S. Bureau of Labor Statistics. 2016. Standard Occupational Classification. All SOC definitions are available online from https://www.bls.gov/soc/#classification (Accessed January 2017).
3. U.S. Bureau of Labor Statistics. 2014. Revising the Standard Occupational Classification. https://www.bls.gov/soc/revising_the_standard_occupational_classification_2018.pdf (Accessed January 2017).
Note:
Chart 25b – This table includes industry groups (in bold) and selected industry subsectors.
Charts 25b and 25c – The median is the midpoint; half of the reported wages are larger and half are smaller.
Source:
Chart 25a – U.S. Bureau of Labor Statistics. May 2015 national occupational employment and wage estimates. http://www.bls.gov/oes/current/oes_nat.htm (Accessed April 2016).
Charts 25b and 25c – U.S. Bureau of Labor Statistics. May 2015 national industry-specific occupational employment and wage estimates. http://www.bls.gov/oes/current/oessrci.htm (Accessed April 2016).