Chart Book (6th edition): Labor Force Characteristics – Occupational Classifications and Employment Distributions in Construction
11. Occupational Classifications and Employment Distributions in Construction
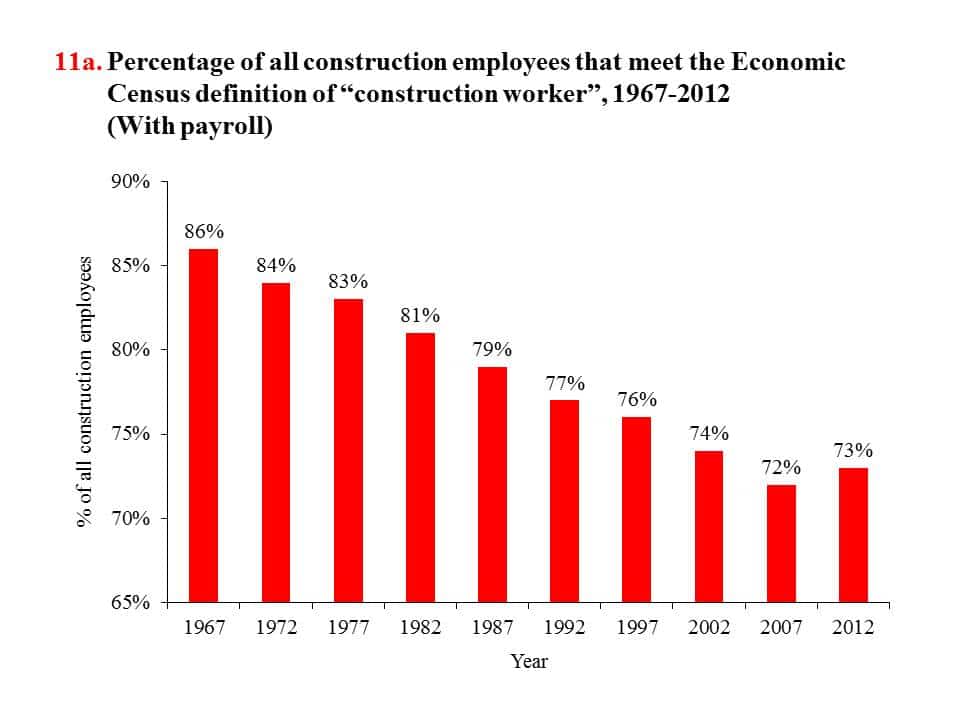
The construction workforce is defined by the Economic Census (see pages 2 and 3) as “construction workers” and “other employees”. “Construction workers” includes those directly engaged in construction operations, such as apprentices, working foremen, painters, carpenters, and laborers. “Other employees” refers to supervisors above working foremen, as well as office staff, executives, architects, engineers, and others engaged in non-construction activities.1 Using these definitions, the proportion of construction workers in construction payroll establishments declined from 86% in 1967 to 73% in 2012 (chart 11a). This overall decrease reflects development in construction management and technology.2 Construction industry innovations have and will continue to transform the workforce in profound ways.3,4 Moreover, worker safety, environmental protection, and pressure to complete projects on time and within budget limitations are also driving employment growth in managerial and professional occupations (see pages 29 and 31).2,3,5
Surveys related to the workforce (such as the Current Population Survey, see page 10; the Occupational Employment Statistics, see page 25) often classify the construction workforce into detailed occupations by work performed, skills, or training needed to perform the work.6 These classifications are altered and updated over time (see page 25). Most of the occupational data used in this chart book are based on the 2010 Census Occupational Classification system,7 which includes 10 major occupational groups:
- Management, business, and financial (0010-0950)
- Professional and related occupations (1000-3540)
- Service (3600-4650)
- Sales and related occupations (4700-4965)
- Office and administrative support (5000-5940)
- Farming, fishing, and forestry (6000-6130)8
- Construction and extraction (6200-6940)
- Installation, maintenance, and repair (7000-7630)
- Production (7700-8965)
- Transportation and material moving (9000-9750)
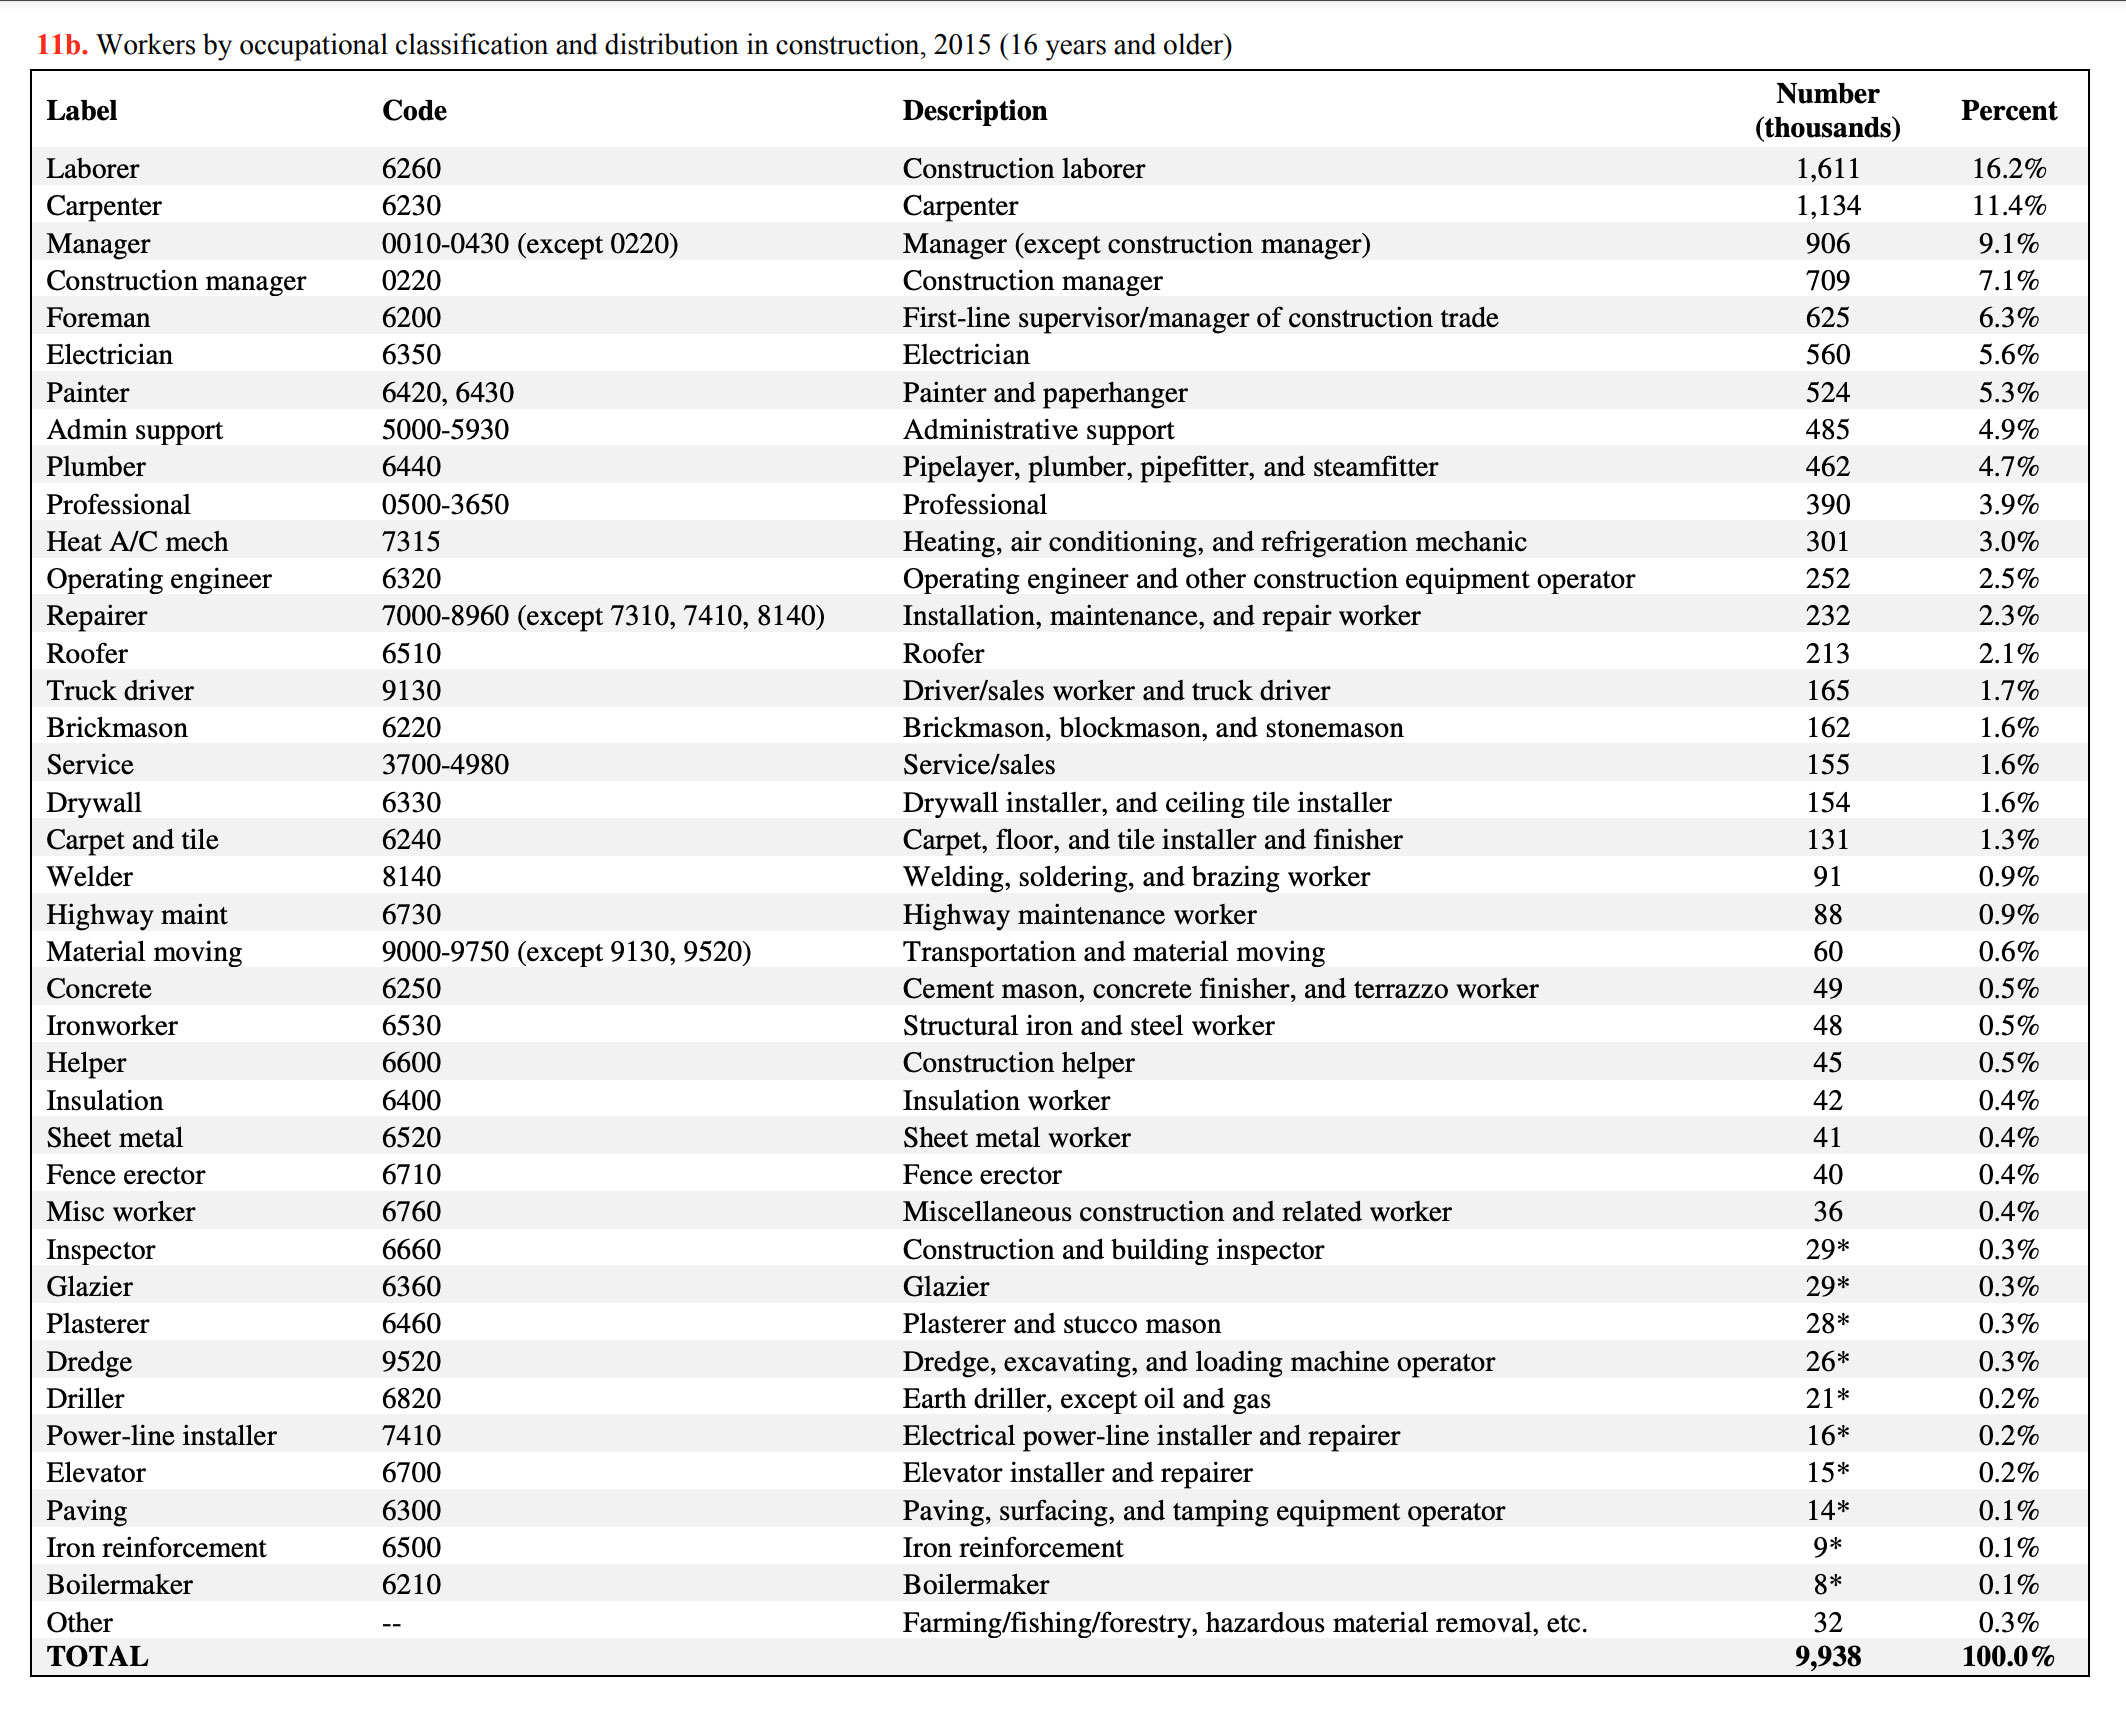
Chart 11b presents employment by detailed occupational categories as a percent of the total construction workforce in 2015. Laborers and carpenters are the two largest occupations in construction, together accounting for nearly 30% of the construction workforce (chart 11b). Notably, some related occupations are combined; for example, installation, maintenance, and repair workers are listed under the repairer occupation. Except when noted, the combined occupational categories are used consistently throughout this chart book. The numbers presented in this chart book may differ from other published counts since occupations may be grouped in different ways.
In this chart book, the construction workforce is also categorized as production workers (blue-collar; Census codes 6200-9750; similar to “construction workers” used in chart 11a) and non-production workers (white-collar; Census codes 0010-5940; similar to “other employees” described above and includes managerial and administrative support staff) 8. Unless otherwise noted, the term “construction workers” in this chart book refers to all those employed in the construction industry, regardless of occupation.
(Click on the image to enlarge or download PowerPoint or PDF versions below.)
Download chart 11a (PowerPoint)
Glossary:
Production workers – In this chart book, production workers are the same as blue-collar workers. From the Current Population Survey: all workers, except managerial, professional (architects, accountants, lawyers, etc.), and administrative support staff. Production workers can be either wage-and-salary or self-employed workers.
1. U.S. Census Bureau. 2012 Economic Census. Construction: Summary Series. General Summary: Detailed Statistics for Establishments: 2012, (EC1223SG01) http://www.census.gov/data/tables/2012/econ/census/construction.html (Accessed April 2016).
2. Wright S. 2016. 6 Ways Construction Technology Has Transformed the Industry. http://blog.capterra.com/6-ways-construction-technology-has-transformed-the-industry/ (Accessed November 2016).
3. Whirlwind Team. 2015. 5 Ways the Construction Industry Has Changed in 20 Years. http://www.whirlwindsteel.com/blog/bid/406699/5-ways-the-construction-industry-has-changed-in-20-years (Accessed November 2016).
4. The World Economic Forum. 2016. The Future of Jobs. http://reports.weforum.org/future-of-jobs-2016/ (Accessed November 2016).
5. U.S. Bureau of Labor Statistics. 2015. Occupational Outlook Handbook. Construction Managers: Job Outlook. http://www.bls.gov/ooh/Management/Construction-managers.htm#tab-6 (Accessed March 2016).
6. U.S. Bureau of Labor Statistics. 2016. Standard Occupational Classification. http://www.bls.gov/soc/#classification (Accessed November 2016).
7. U.S. Bureau of Labor Statistics. Census 2010 Occupation Codes. http://www.bls.gov/tus/census10ocodes.pdf (Accessed November 2016).
8. Less than 0.1% of construction workers were coded in this occupational group.
Note:
Chart 11a – Yearly figures are based on quarterly averages. “Construction workers” are defined as non-supervisory and non-clerical.
Chart 11b – Construction managers plan, coordinate, budget, and supervise construction projects from start to finish. Managers (except construction managers) refer to all other managerial occupations, including architectural and engineering managers, equipment managers, financial managers, human resources mangers, etc. Operating engineers maintain and run heavy equipment, such as bulldozers and tower cranes. Braziers join metals using lower heat than welders use. “Other” includes farming/fishing/forestry, hazardous material removal workers, explosives workers, pile-driver operators, rail-track laying and maintenance equipment operators, and septic tank servicers and sewer pipe cleaners. An asterisk (*) indicates relatively small sample sizes that may make these numbers less reliable.
Source:
Chart 11a – U.S. Census Bureau. 2012 and previous years Economic Census, Construction.
Chart 11b – U.S. Bureau of Labor Statistics. 2015 Current Population Survey. Calculations by the CPWR Data Center.

