Construction Safety and Health Tracking Plan (Completed – 2009-2014)
Xiuwen (Sue) Dong, DrPH
CPWR
Ph: 301-578-8500 ext.8528
[email protected]
Research Team
Xuanwen Wang, PhD, Julie Largay, MPH
The selected findings and products through this project include:
The Construction Chart Book: fifth edition
In April 2013, CPWR published the much-anticipated fifth edition of The
Construction Chart Book: The U.S. Construction Industry and its Workers.
The Chart Book has served as a go-to reference for construction stakeholders
for 16 years. Like previous editions, the new Chart Book characterizes the changing American construction industry and workforce, monitors the impact of such changes on worker safety and health, and identifies priorities for future safety and health interventions. The new edition updates statistics on topics
traditionally covered, but also delves into emerging issues within the construction industry, such as green construction, the aging workforce, employment projections, and OSHA inspections, violations, and citations. This edition contains more than 250 charts and tables in 55 topic pages.

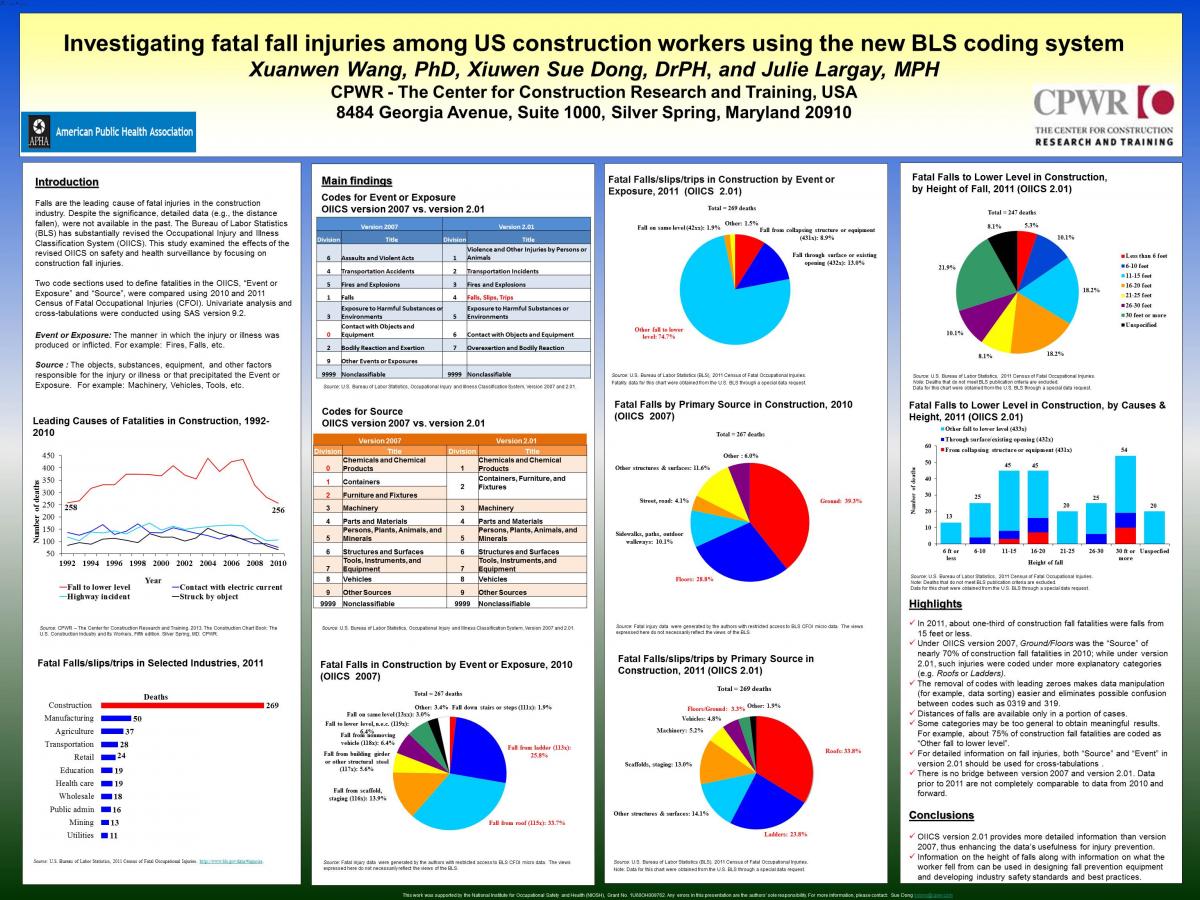
Investigating Fatal Injuries Using the New BLS Coding System
The Data Center obtained more detailed injury information in construction using the new BLS Occupational Injury and Illness Classification System (OIICS 2.01). In 2011, about one-third of construction fall fatalities were falls from 15 feet or less. Such measures and level of detail were not available in previous years. In addition, while nearly 70% of fatal falls in 2010 were simply coded “Floors/ Ground” under the old OIICs system, OIICS 2.01 offers more explanatory categories like “Roofs” or “Ladders.” Data Center findings were presented at the BLS conference, Celebrating 40 Years of Safety and Health Data, in May 2013, and accepted for publication in BLS’ Monthly Labor Review. The poster presentation below was accepted and displayed at the American Public Health Association conference in 2013.
(Click the image to view the PowerPoint presentation.)
Web-based Fatality Map: Support the National Fall Prevention Campaign
Using a combination of OSHA inspection data and mass media reporting, the Data Center has created a graphic representation of construction fatalities in the U.S. By clicking on the pinpoints, users can locate where a construction worker lost his or her life on the job, learn how the incident happened, and read how the information was gathered.
Fatal Falls from Roofs among U.S. Construction workers
Between 1992 and 2009, falls from roofs accounted for about one third of fatal falls in construction, with a disproportionate percentage (67%) of these occurring in small construction establishments (1–10 employees). Categories of workers at elevated risk included roofers, ironworkers and residential construction workers. Data Center researchers also found an increased rate of fatal falls from roofs among the youngest (<20 years) and oldest (>44 years) workers, Hispanic workers, and immigrant workers. Findings from this research were published in the Journal of Safety Research.
Injury Underreporting among Small Construction Establishments
Small construction establishments are most likely to underreport injuries, especially those of Hispanic workers. From this analysis, it is estimated that the Bureau of Labor Statistics (BLS) captured just 25% of severe injuries among Hispanic workers and 60% of severe injuries among white non-Hispanic workers in small construction establishments. These findings were published in the American Journal of Industrial Medicine (2011. 54(5):339-349).
Construction Fatalities by Height of Fall
More detailed injury information in construction is yielded when analyzing fatality data by the new, revised BLS injury and illness codes (OIICS v 2.01). In 2011, about one-third of construction fall fatalities were falls from 15 feet or less. Such measures and level of detail are not available when using the old codes. In addition, “ground” was the source of nearly 40% of fatal falls coded by the previous system, which was meaningless for fall prevention. Under the new coding system, “ground” claimed just 1.5% of fall injuries in 2011. The initial findings were presented at the BLS conference, Celebrating 40 Years of Safety and Health Data, in May 2013.
