Self-employed Workers
Construction has a higher proportion of self-employed workers than all nonfarm industries due to the nature of construction jobs and work. Self-employed workers are at a higher risk of injuries due to less safety and health protection, such as OSHA regulations.
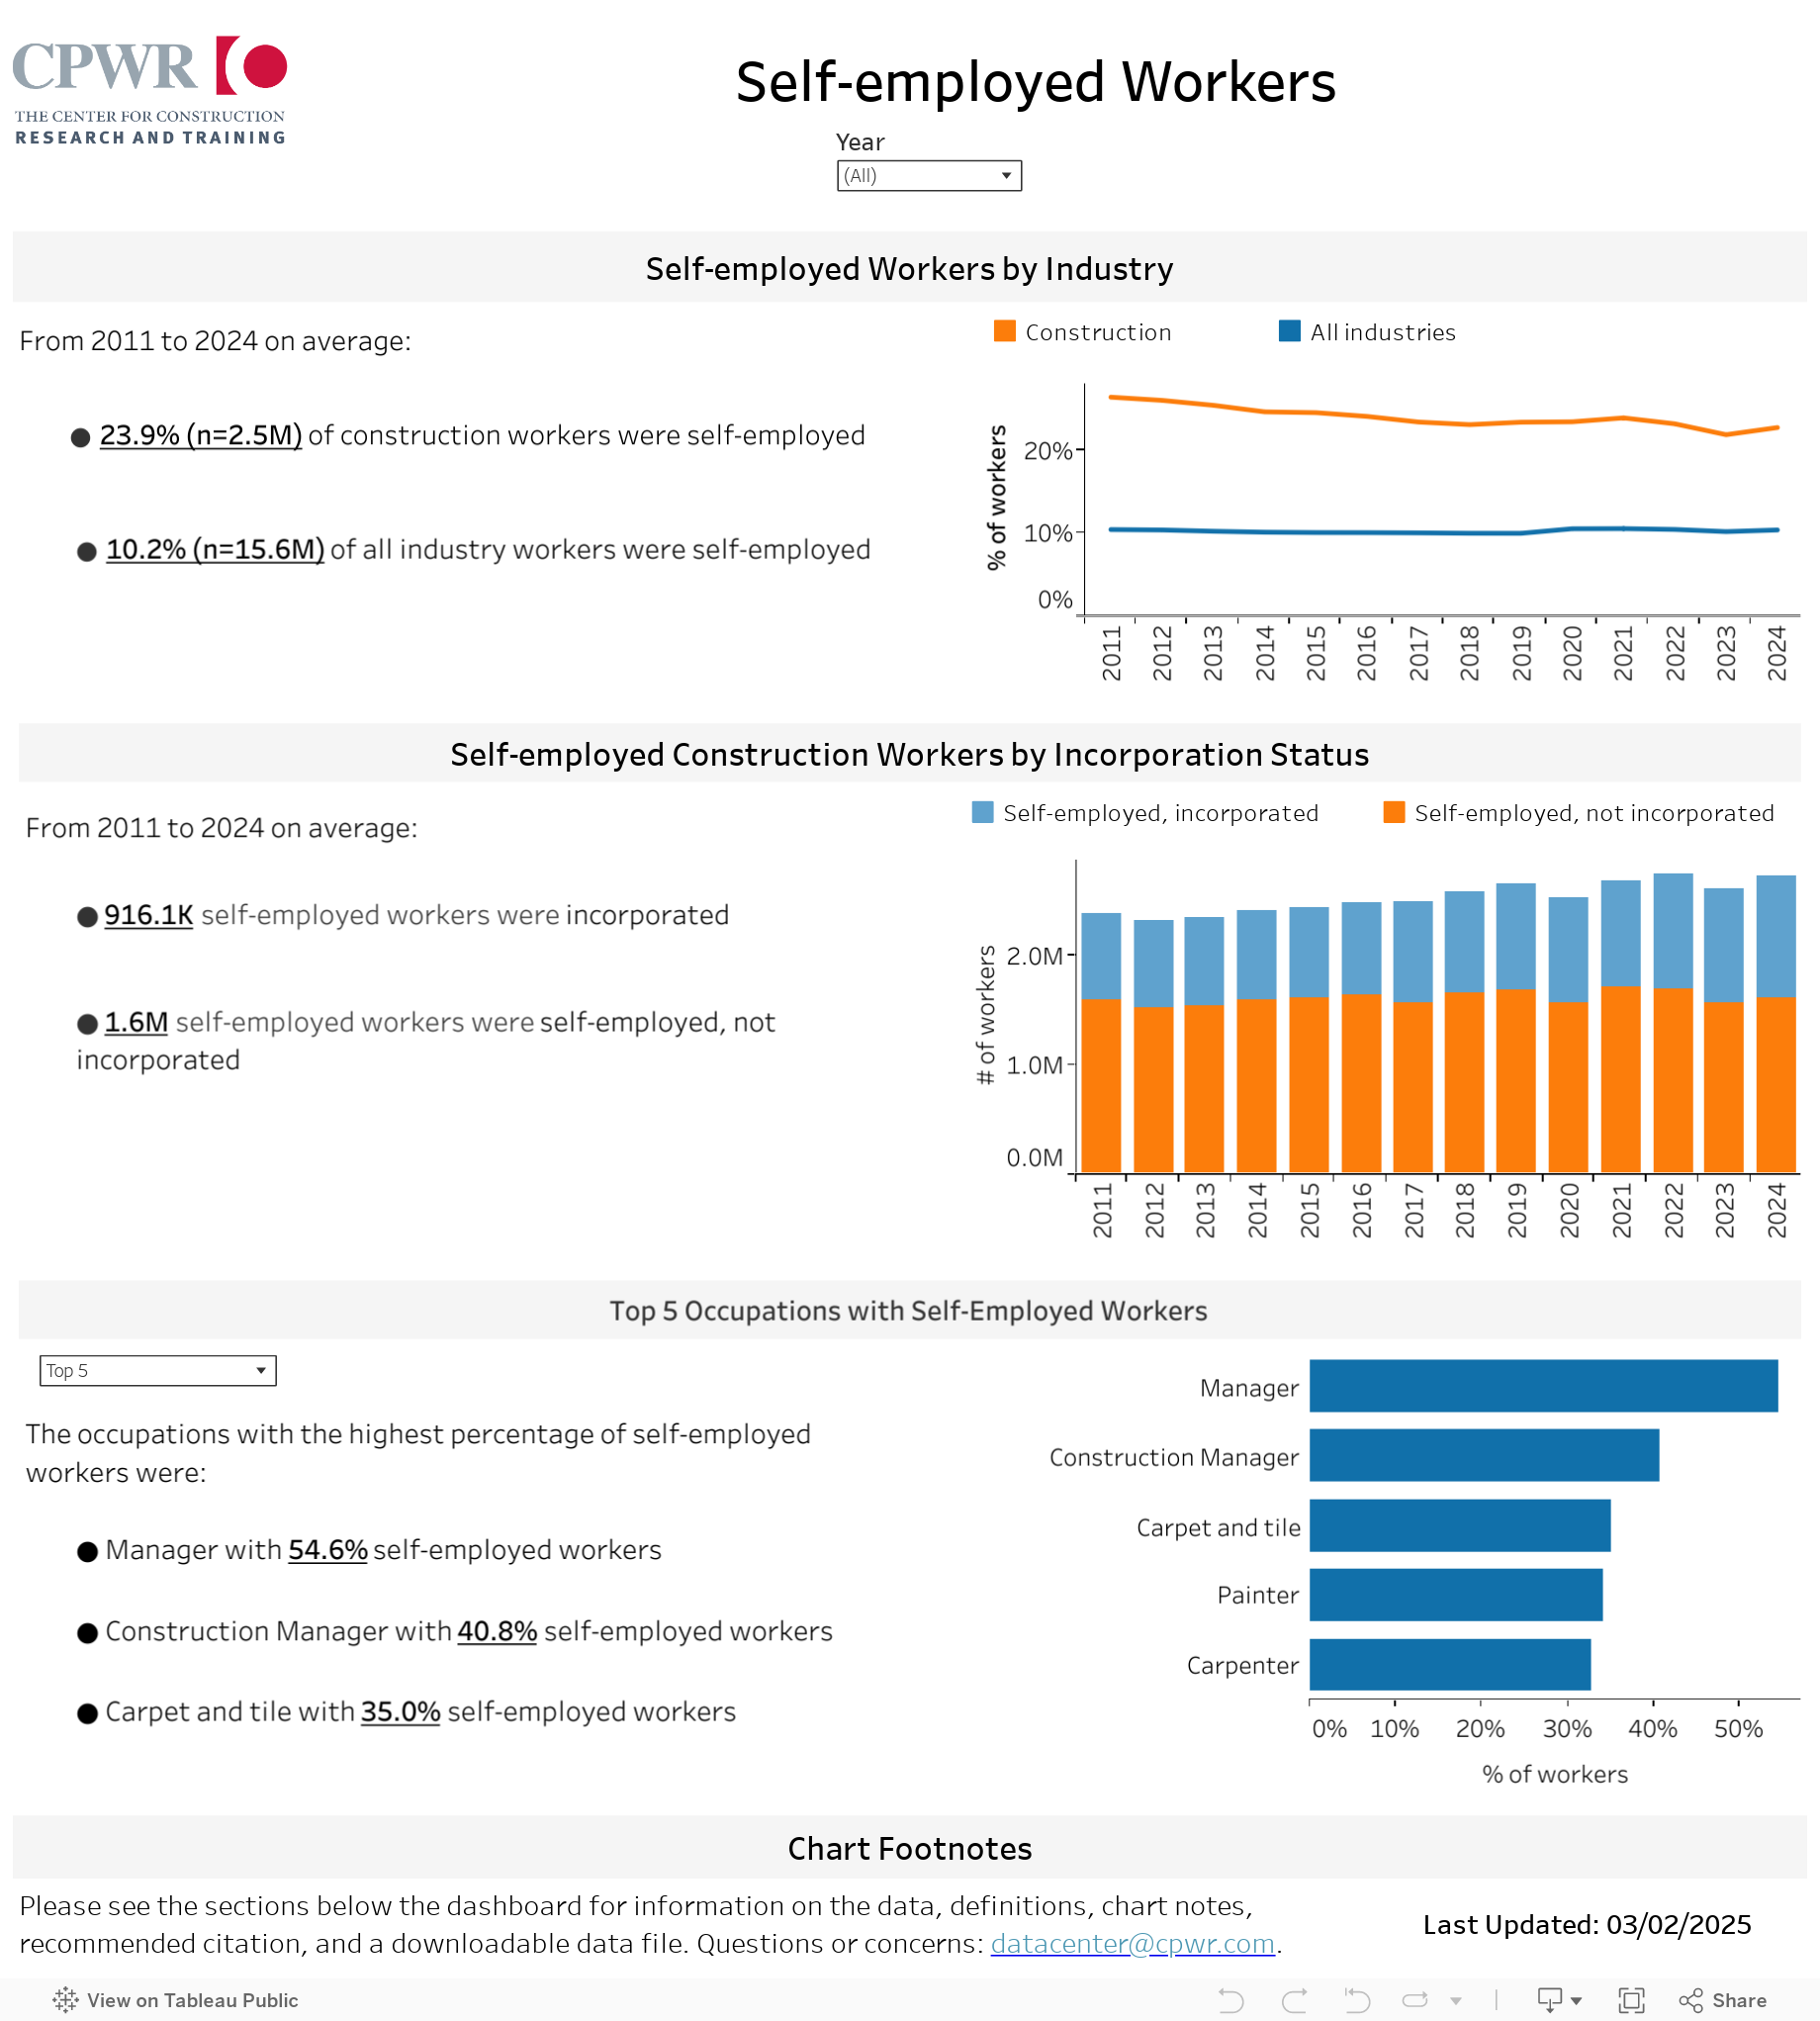
This interactive dashboard analyzes trends in self-employed construction workers from 2011 to 2023 by industry, incorporation status, and occupation. The Year filter(s) updates both the charts and the bolded and underlined key findings.
Following the interactive dashboard, you will find more information on the data source, definitions, chart notes, a downloadable data file, and recommended citation. This interactive data dashboard corresponds to a chapter in the upcoming PDF version of the Construction Chart Book-7th edition, which will be published this summer. Data will be updated annually as available. If you have any questions or comments, please email [email protected].
About the Data
Data come from the U.S. Bureau of Labor Statistics Current Population Survey, 2011-2023.
Sarah Flood, Miriam King, Renae Rodgers, Steven Ruggles, J. Robert Warren, Daniel Backman, Annie Chen, Grace Cooper, Stephanie Richards, Megan Schouweiler, and Michael Westberry. IPUMS CPS: Version 12.0 [dataset]. Minneapolis, MN: IPUMS, 2024. https://doi.org/10.18128/D030.V12.0
Definitions
- Incorporation status – Indicates if a self-employed individual worked for an incorporated business.
- Incorporated – Includes those whose business was incorporated. These workers are typically included with private wage-and-salary workers because they are paid employees of their own companies.
- Unincorporated – Includes those who worked for profit or fees in their own unincorporated business, profession, or trade. Refers to those who work for themselves, such as independent contractors, independent consultants, and freelance workers. Most often they do not have paid employees.
- Occupation – The primary occupation of the respondent with the most hours worked during the preceding week if employed. Email [email protected] for specific codes used for each occupation.
- Self-employed – Includes unincorporated and incorporated workers.