O*NET Occupational Exposures in Construction
Construction workers frequently work in environments with unsafe conditions, including severe temperatures, loud noises, extremely bright or dim lighting, and countless other chemical and physical hazards (e.g., silica dust, power tools, or heavy machinery). Many of these occupational hazards and exposures can lead to severe injury or illness, necessitating the need for continuous monitoring.
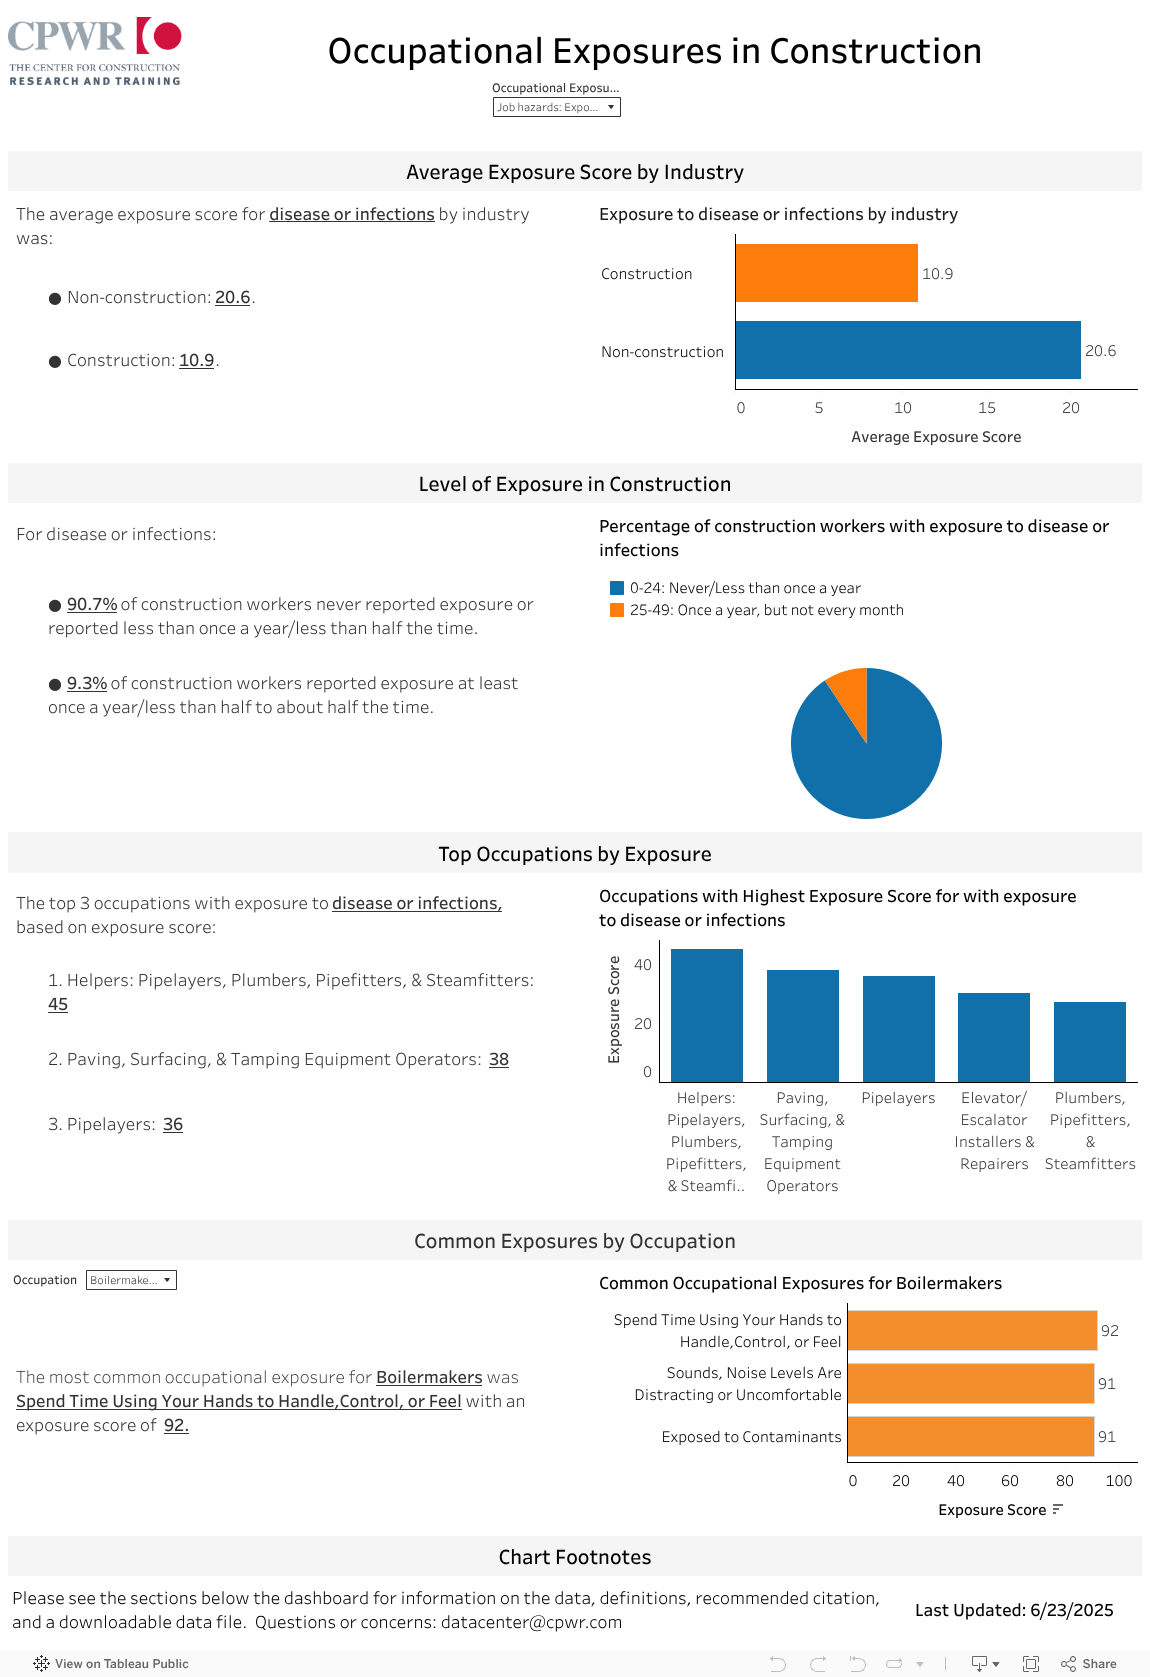
Using data from the Occupational Information Network database, this dashboard examines occupational exposure scores for a variety of conditions found on construction sites, including job hazards, environmental exposures, and risky body positions. The Occupational Exposure and Occupation filters update both the charts and the bolded and underlined key findings.
Following the interactive dashboard, you will find more information on the data source, definitions, chart notes, a downloadable data file, and recommended citation. This interactive data dashboard corresponds to the relevant chapter in the PDF version of the Construction Chart Book, 7th edition.
If you have any questions or comments, please email [email protected].
About the Data
Data is downloaded from the O*NET OnLine database.
2024 O*NET OnLine Database. https://www.onetonline.org/.
Definitions and Chart Notes
Definitions
- Exposure scores – A score of 0 means that workers are never exposed to a given hazard, whereas a score of 100 is assigned when exposure occurs daily or continually. All exposures reported in this chapter use the following scale: 0=Never, 25=Once a year or more but not every month; 50=Once a month or more but not every week; 75=Once a week or more but not every day; and 100=Every day.
- Construction Occupations – Occupations in which 51% or more of employees reported work under North American Industry Classification System (NAICS) 23 (Construction). Occupations are reported by their Standard Occupation Classification (SOC) code.
Chart Notes
- The first bar chart compares the average score for construction with the average score for occupations in all industries.