Severe Injuries
Since 2015, the Occupational Safety and Health Administration (OSHA) has required employers under its jurisdiction to report all severe work-related injuries, defined as an amputation, in-patient hospitalization, or loss of an eye (OSHA). These reports contain detailed data about the injuries, including information on the type of injury, source of injury, and body part affected; they also include narratives that describe the circumstances of the injury. Although these reports only cover workers under federal OSHA jurisdiction, since many states have state-run occupational health and safety programs, this data represents an extensive source of information on the more severe injuries construction workers experience.
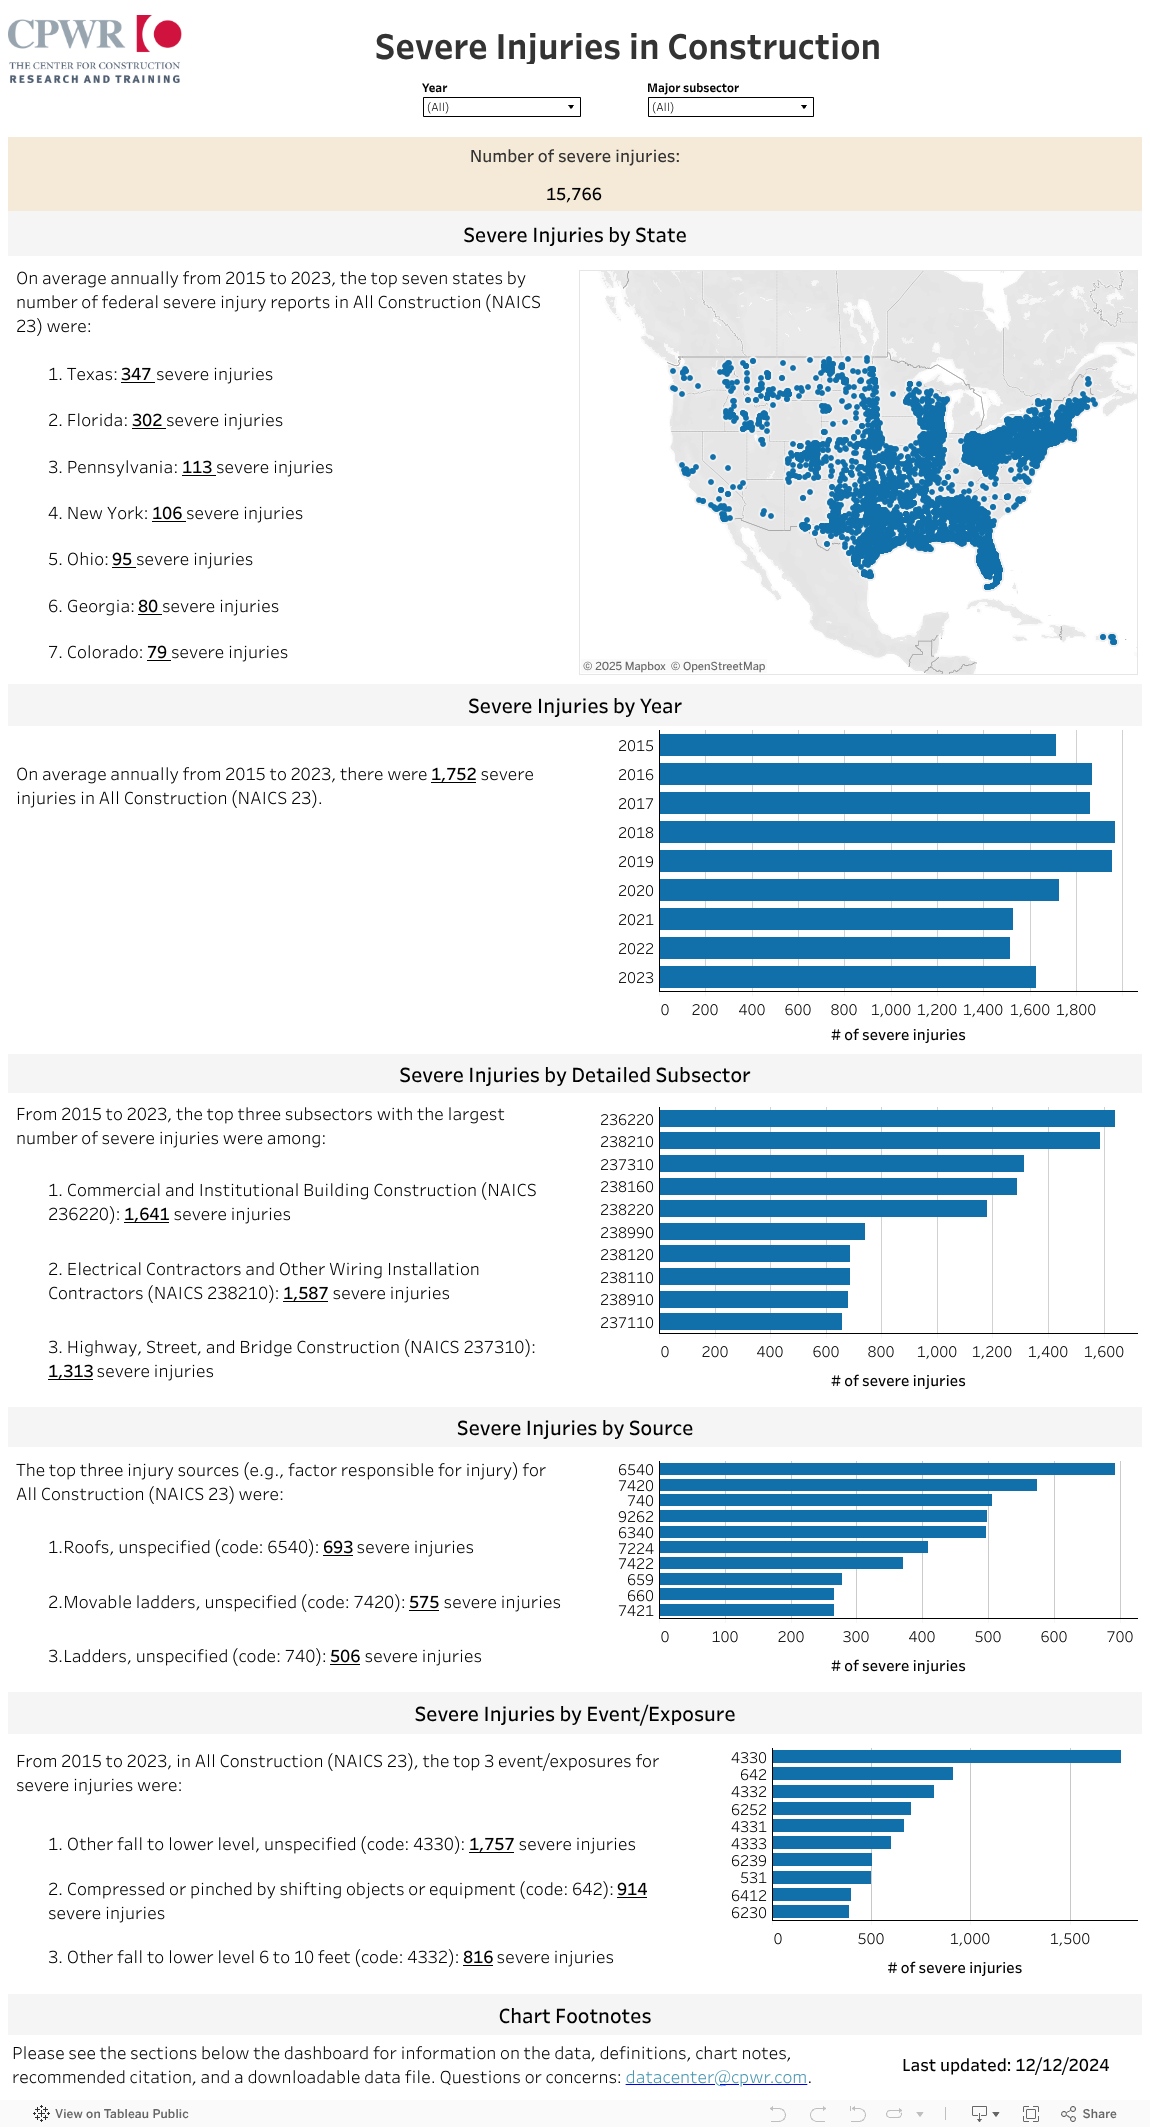
From 2015 to 2024, there have been more than 17,000 severe injuries in construction (as seen below). This interactive dashboard characterizes these injuries to help reveal patterns. The map includes detailed injury narratives when a point is clicked on, while the other charts show the most common sources (e.g., factor responsible for the injury), event/exposure of injury, and detailed subsectors affected. The Time Period, Year and Major subsector filter(s) update both the charts and the bolded and underlined key findings. The Time Period filter accounts for data changing from Occupational Injury and Illness Classification System (OIICS) 2.0 to 3.0 in 2024 which impacts data comparability pre- and post-2024.
Following the interactive dashboard, you will find more information on the data source, definitions, chart notes, a downloadable data file, and recommended citation. This interactive data dashboard corresponds to the relevant chapter in the PDF version of the Construction Chart Book, 7th edition.
If you have questions or comments, please email [email protected].
About the Data
Occupational Safety and Health Administration, Severe Injury Reports, 01/01/2015-12/31/2024. https://www.osha.gov/severeinjury
- Due to issues with latitudes and longitudes provided in the OSHA Severe Injury reports, CPWR Data Center’s maps use reported zip codes to produce latitudes and longitudes. Missing zip codes are generated based on available information. Latitudes and longitudes are separated (e.g., jittered) to prevent multiple values from occupying the same location on the map.
Definitions and Chart Notes
Definitions
- Detailed subsector – 4 to 6-digit NAICS codes within construction. Severe injury data shows the 6-digit NAICS codes.
- Event/Exposure – The manner in which the injury or illness was produced or inflicted, such as a fall, heat-related illness, etc. Pre-2024 data uses OIICS 2.0, while post-2024 data uses OIICS 3.0. For more information see: https://www.bls.gov/iif/definitions/occupational-injuries-and-illnesses-classification-manual.htm.
- Severe injury – An injury resulting in amputation of limb, loss of eye, or hospitalization.
- Source – The objects, substances, equipment, and other factors that were responsible for the injury or illness incurred by the worker, such as a ladder, cutting hand tools, etc. Pre-2024 data uses OIICS 2.0, while post-2024 data uses OIICS 3.0. For more information see: https://www.bls.gov/iif/definitions/occupational-injuries-and-illnesses-classification-manual.htm.
Chart Notes
Source codes were reduced to the 3-digit level and OIICS category titles assigned by CPWR’s Data Center to make codes comparable.
Event chart shows top 4-digit codes.
Full source and event codes are shown in the map tooltip and in the downloadable data file.