Electrical Injuries
Electrocutions, a Focus Four injury, are one of the leading causes of fatal and nonfatal injuries in construction with over 50 fatal and 300 nonfatal electrical injuries annually since 2011. Monitoring electrical injury trends may help reduce exposure to electrical hazards through prevention and intervention efforts.
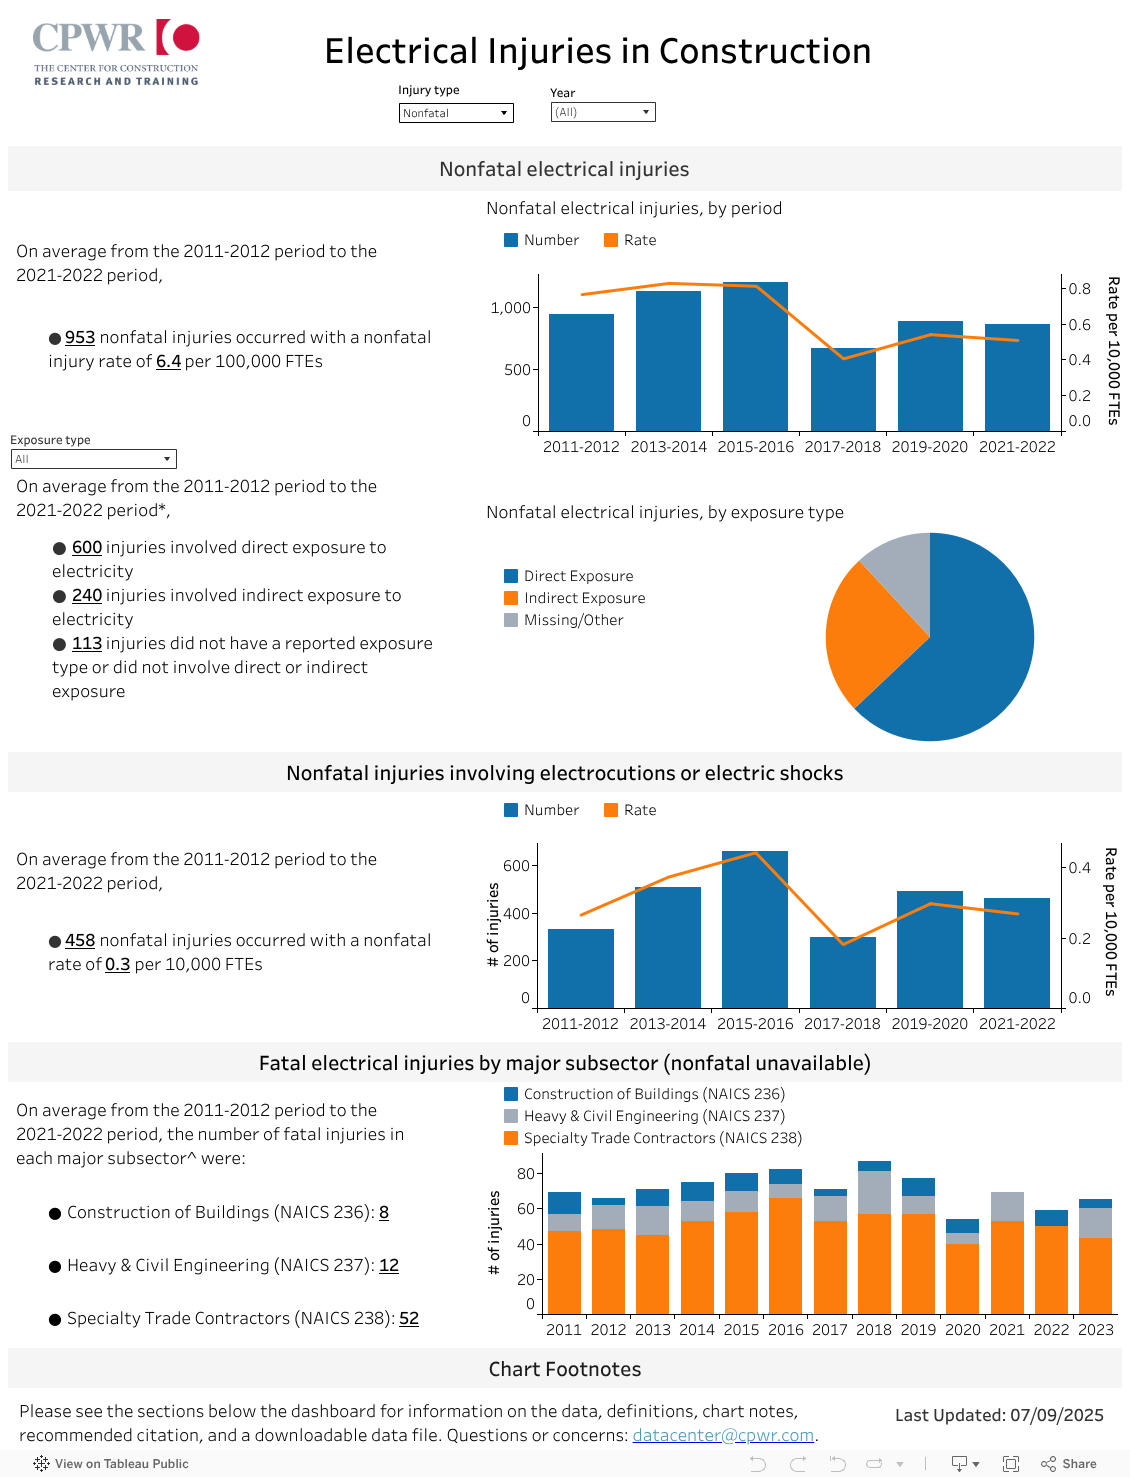
This interactive dashboard highlights fatal and nonfatal electrical injury trends in construction, including information by year, event/exposure, and major subsector and injuries involving electrocutions and electric shocks. The dashboard-level filters, injury type and year, and the chart-level filters exposure type, update the charts and the bolded and underlined key findings. Other text, such as transitions and labels, also change with filters but are not formatted differently.
Following the interactive dashboard, you will find more information on the data source, definitions, chart notes, a downloadable data file, and recommended citation. This interactive data dashboard corresponds to the relevant chapter in the PDF version of the Construction Chart Book, 7th edition.
If you have questions or comments, please email [email protected].
About the Data
Sarah Flood, Miriam King, Renae Rodgers, Steven Ruggles, J. Robert Warren, and Michael Westberry. Integrated Public Use Microdata Series, 1985-2023 Current Population Survey: Version 9.0 [dataset]. Minneapolis, MN: IPUMS, 2022. https://doi.org/10.18128/D030.V9.0.
U.S. Bureau of Labor Statistics (BLS), 2011-2023 Census of Fatal Occupational Injuries (CFOI) https://www.bls.gov/iif/.
U.S. Bureau of Labor Statistics (BLS), 2011-2022 Survey of Occupational Injuries and Illnesses (SOII) https://www.bls.gov/iif/.
- The U.S. Bureau of Labor Statistics now releases SOII data biannually.
Definitions and Chart Notes
Definitions
- Event/Exposure – The manner in which the injury or illness was produced or inflicted, such as a fall, heat-related illness, etc. For example, a worker who was using a hand-held electric auger which struck a powerline would have a reported event or exposure of “Exposure to electricity,” with their reported primary source being “Tools, instruments, and equipment: Handtools-powered.” Full definitions for categories can be found in the Occupational Injury and Illness Classification Manual.
- Electrical injuries (OIICS 51) – The injury or illness resulting from contact with electricity, including electric shock and electrocutions.
- Exposures greater than 220 volts (OIICS 5112 and OIICS 5122) – Overhead voltage (e.g., power lines and industrial transformers) may operate at 220 volts or greater.
- Exposures 220 volts or less (OIICS 5111 and OIICS 5121) – Household voltage is typically 220 volts or less.
- Exposure type – Describes how contact was made with the electrical source.
- Direct exposure (OIICS 511) – Contact made by directly touching the power source, such as a live wire.
- Indirect exposure (OIICS 512) – Contact made by a conductive material touches an electricity source, such as a crane hitting a power line.
- Focus Four – The four most common causes of injuries in construction as defined in 1994: caught-in/between, electrocution, fall, and struck-by injuries.
- Major subsector – 3-digit NAICS codes within construction, including Construction of Buildings (NAICS 236), Heavy and Civil Engineering Construction (NAICS 237), and Specialty Trade Contractors (NAICS 238).
- Nature – The physical characteristics of the work-related injury or illnesses. Full definitions for categories can be found in the Occupational Injury and Illness Classification Manual.
- Electrical burns (OIICS 153) – Nature of injury reported as burns resulting from electricity.
- Electrocutions, electric shocks (OIICS 193) – Nature of injury reported as injuries resulting from contact with electric current.
- Wage-and-salary – Workers who receive wages, salaries, commissions, tips, or pay from their employer.
- Electrical injuries (OIICS 51) – The injury or illness resulting from contact with electricity, including electric shock and electrocutions.
Chart Notes
- Nonfatal data is for private wage-and-salary workers.
- Fatal data for exposure type chart is for private industry construction workers.
- Exposure type:
- Fatal injury data goes through 2023 while nonfatal injury data goes through 2022.
- Fatal injury data uses annual injury estimates while nonfatal data uses biennial estimates due to BLS switching SOII to biennial for 2021-2022 data.
- Data is unavailable for the following exposure types and years:
- Fatal Injury data:
- Direct exposure: 2019
- Direct exposure, 220 volts or less: 2019 and 2020
- Direct exposure, greater than 220 volts: 2019
- Indirect exposure: 2019 and 2020
- Indirect exposure, 220 volts or less: 2012 and all years following 2018
- Indirect exposure, greater than 220 volts: 2019 and 2020
- Nonfatal injury data:
- Direct exposure, 220 volts or less: 2017, 2018, and 2021-2022.
- Direct exposure, greater than 220 volts: All years following 2016.
- Indirect exposure, 220 volts or less: All years following 2013
- Indirect exposure, greater than 220 volts: 2013, 2014, 2016, 2018, and all years following 2019.
- Indirect exposure, unspecified: 2012, 2014, 2019, and 2020.
- Due to rounding, nonfatal injuries by detailed exposure type (e.g., 220 volts or less, greater than 220 volts, unspecified) may equal more than the total for injuries involving direct exposure for 2012, 2014, and 2016.
- Fatal Injury data:
- Major subsector:
- Missing data for Construction of Buildings (NAICS 236) in 2021 and Heavy and Civil Engineering (NAICS 237) in 2022.