Compensation Costs and Hourly Wages
Monitoring employment/compensation costs—including both wages and salaries and benefits—provides information on the labor market and, by extension, the overall economy.
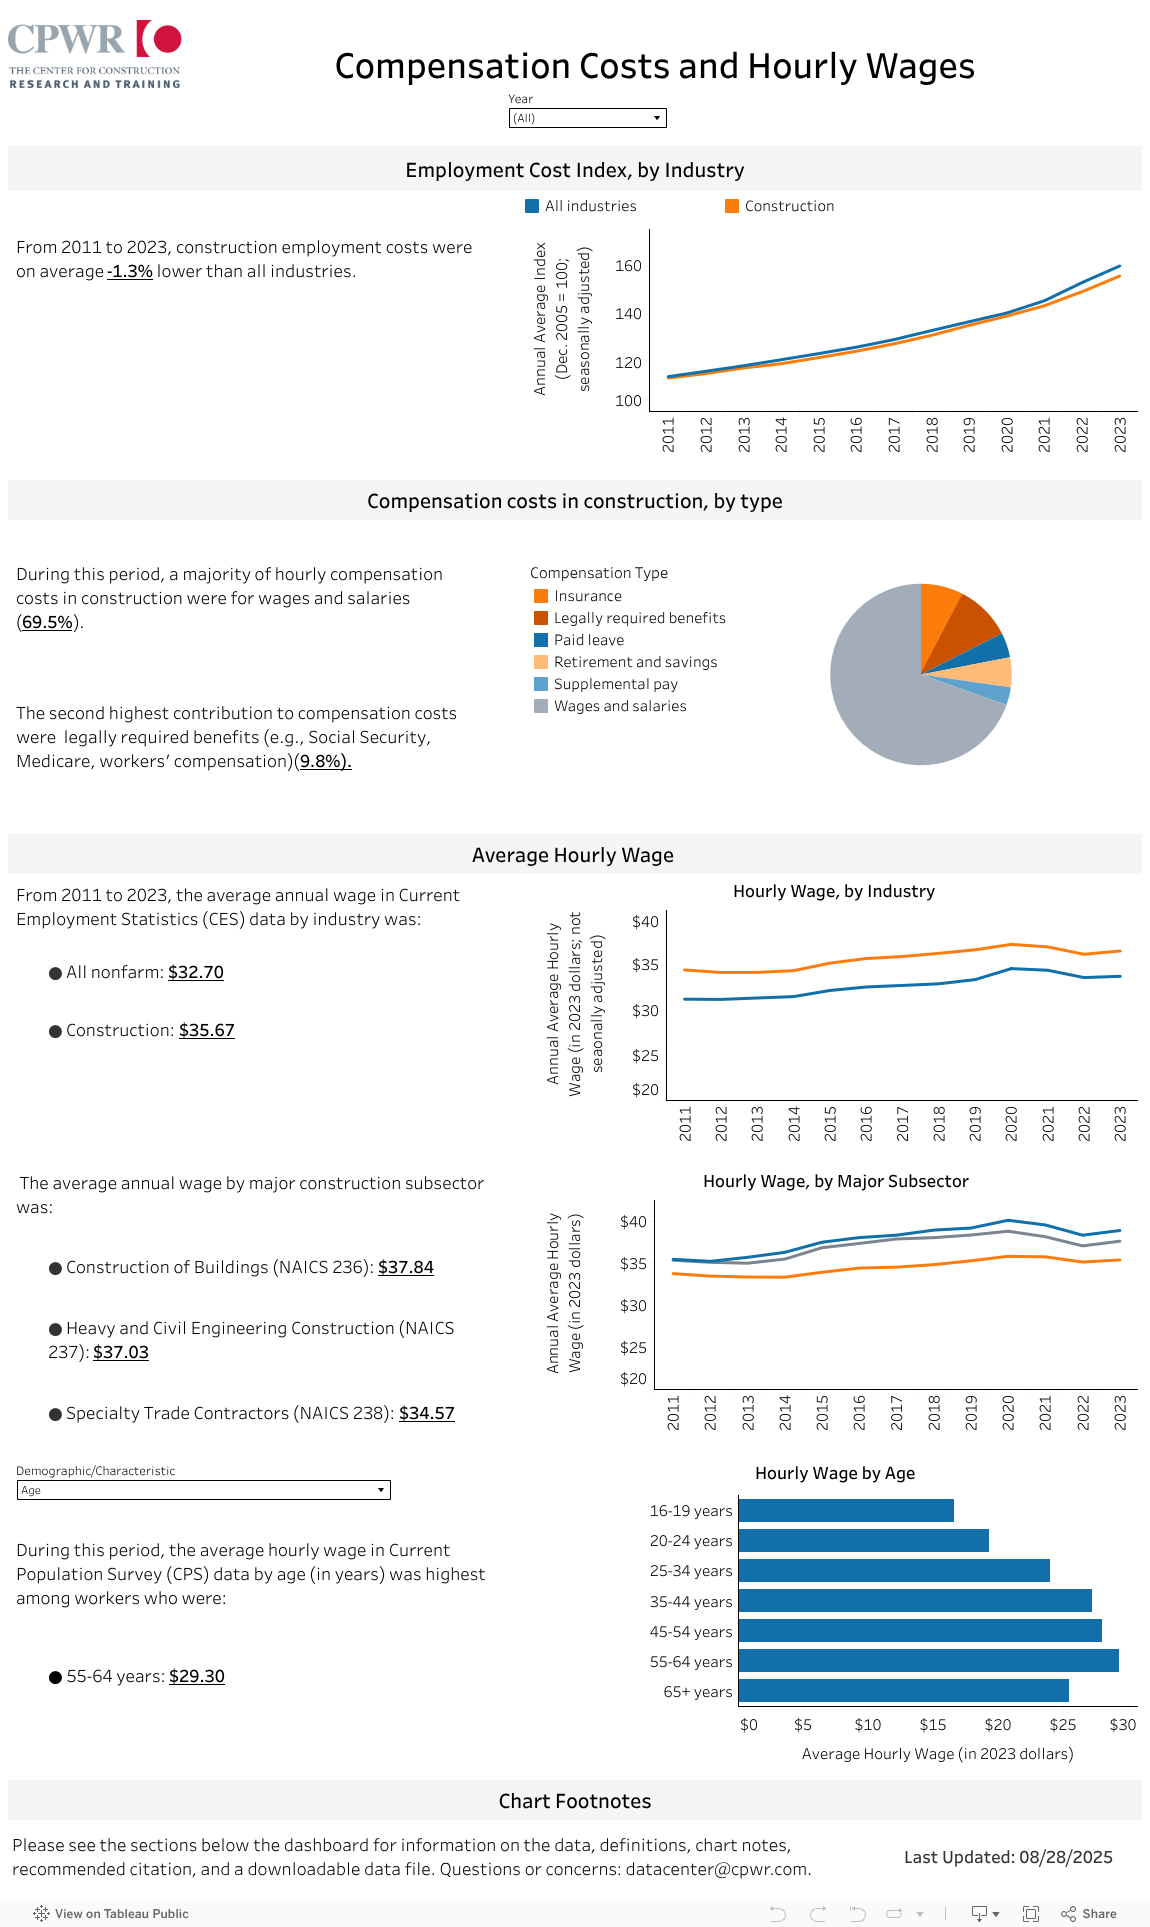
This dashboard examines compensation costs and hourly wages among workers in construction and in all industries, as well as for major construction subsectors and demographics/characteristics. This dashboard includes one dashboard-level filter, Year, that updates the charts and the bolded and underlined key findings. There is also one chart-level filter that updates the demographic/characteristic chart.
Following the interactive dashboard, you will find more information on the data source, definitions, chart notes, a downloadable data file, and recommended citation.This interactive data dashboard corresponds to the relevant chapter in the PDF version of the Construction Chart Book, 7th edition.
If you have any questions or comments, please email [email protected].
About the Data
Sarah Flood, Miriam King, Renae Rodgers, Steven Ruggles, J. Robert Warren, Daniel Backman, Annie Chen, Grace Cooper, Stephanie Richards, Megan Schouweiler, and Michael Westberry. IPUMS CPS: Version 12.0 [dataset]. Minneapolis, MN: IPUMS, 2024. https://doi.org/10.18128/D030.V12.0.
U.S. Bureau of Labor Statistics (BLS), Current Employment Statistics. https://www.bls.gov/ces/.
U.S. Bureau of Labor Statistics (BLS), Employment Cost Index. https://www.bls.gov/eci/.
U.S. Bureau of Labor Statistics (BLS), Employer Costs for Employee Compensation. https://www.bls.gov/ecec/home.htm.
Definitions and Chart Notes
Definitions
- Benefits– Includes paid leave, supplemental pay, insurance, retirement and savings, and legally required benefits (e.g., Medicare, Social Security).
- Employment Cost Index (ECI)– A quarterly index measuring change over time in labor costs.
- Wages and Salaries– Includes base pay, commissions, bonuses and incentives, as well as cost-of-living adjustments.
Chart Notes
- ECI data covers nonfarm private industries in addition to state and local government workers. (Chart 1: Employment Cost Index)
- ECI excludes federal government, agricultural, and self-employed workers are excluded. (Chart 1: Employment Cost Index)
- ECEC data is for private industry. (Chart 2: Compensation costs)
- CES data is for private wage-and-salary employment. (Chart 3 and 4: Average Hourly Wage by industry and major subsector)