COVID-19 Vaccinations
COVID-19 vaccination rates were actively measured during the COVID-19 pandemic to provide vaccination and hesitancy trends and patterns among construction workers. Data used for the dashboard are from the Delphi Group at Carnegie Mellon University U.S. COVID-19 Trends and Impact Survey, conducted from January 2021 to June 2022 in partnership with Facebook. In addition, to the dashboard the data was originally published in CPWR’s June 2021 Data Bulletin. Learn more about vaccinations and construction from CPWR’s COVID-19 Vaccine Resources page.
Following the dashboard, you will find more information on the data source, definitions, chart notes, a downloadable data file, and recommended citation. This dashboard is no longer being updated due to the conclusion of the COVID-19 Trends and Impact Survey as of June 25, 2022. Data in the dashboard cover up to survey week starting with June 12, 2022, and monthly data by state is unavailable for June 2022. If you have questions or comments, please email [email protected].
Instructions for Use
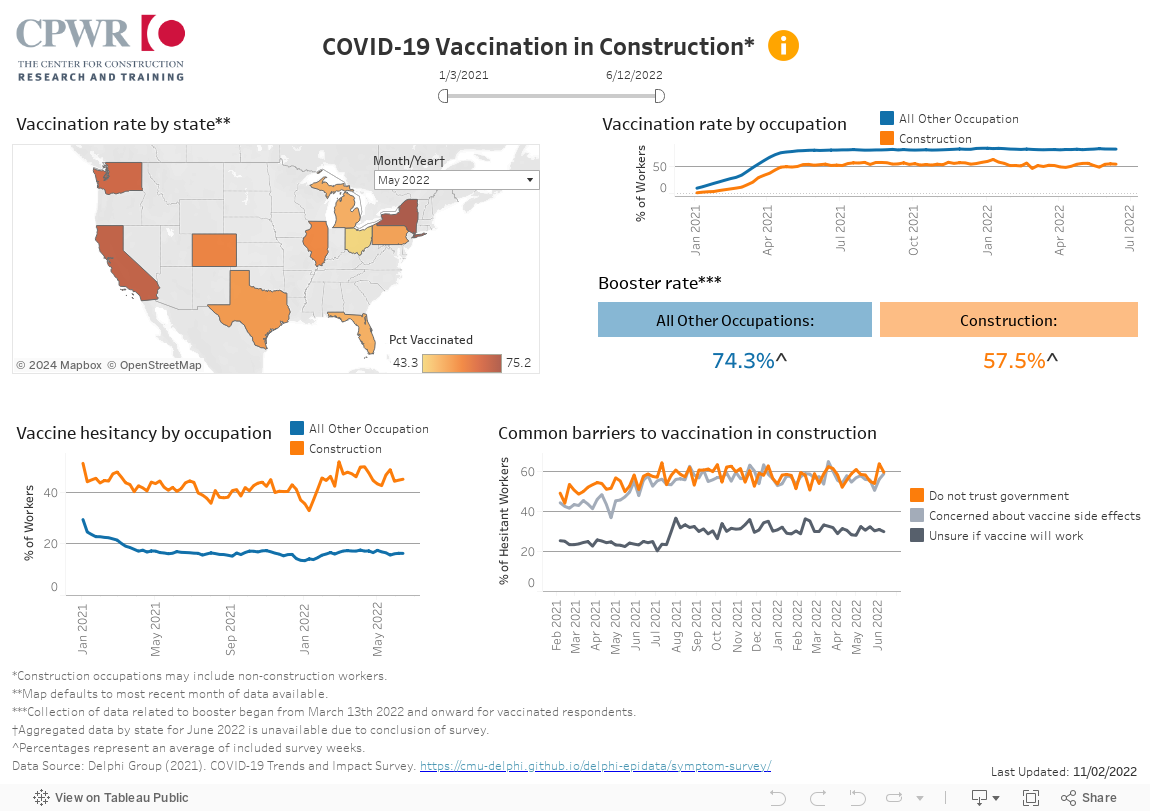
Map: Mouse over (or tap for mobile users) any of the states on the map in order to get information on the percent vaccinated in a state. This map covers monthly state-level data.
Line Chart: Mouse over (or tap for mobile users) any point on the line in order to view percentages, category, and the start of survey week. These charts cover weekly national-level data.
Filters: This dashboard has two filters:
The Month filter controls only the map, and allows you to filter by month of survey data.
The date range filter located underneath the dashboard title allows you to filter the three other charts by survey start date. Simply select your desired range of dates using the sliders.
To undo filter selections, click on the “Reset” button on the bottom right shelf of the dashboard to return to a default view of the dashboard.
About the Data
Delphi Group (2021). COVID-19 Trends and Impact Survey. https://cmu-delphi.github.io/delphi-epidata/symptom-survey/.
Definitions
- All Other Occupations – Defined as all other self-reported occupational categories that are not “Construction and Extraction” occupations.
- Booster rate – Defined as the percentage of vaccinated respondents who had reported that they had received one or more booster shots.
- Common barriers to vaccines – Reported barriers to COVID-19 vaccination for those respondents who have not been vaccinated, did not have an appointment to get vaccinated at time of survey, and answered that they would “probably”, “probably not”, or “definitely not” get vaccinated should a vaccine be offered to them at time of survey. May not sum to 100% as respondents could select more than one barrier and only common barriers are shown.
- Construction – Defined by self-reported occupation in the occupational category “Construction and Extraction”.
- Vaccination rate – The proportion of respondents who have received at least one dose of the COVID-19 vaccine.
- Vaccine hesitancy rate – The proportion of workers who reported vaccine hesitancy among the entire survey sample.