Chart Book (6th edition): Employment and Income – Employment Costs in Construction and Other Industries
23. Employment Costs in Construction and Other Industries
Employment costs, also known as labor costs, includes wages, salaries, employee benefits, and employer-paid taxes.1 When such costs were measured by the Employment Cost Index (see Glossary), the construction industry generally followed the upward trend of all industries over the last decade. However, costs in construction were higher from 2006 through 2010, and lower after 2011 compared with all industries (chart 23a).
While overall employment costs have grown more than 20% since 2005, workers’ earnings have been relatively stagnant. After adjusting for inflation so that wages are comparable over time, average hourly pay for construction workers in 2016 was $28.10, just $1.66 more than their adjusted earnings of $26.44 in 2006 (chart 23b). The wage differential between construction and all industries remained stable over the ten-year period, with construction workers earning $2.48 more than all private workers on average. The higher wages in construction may reflect, in part, higher risks and skills required for most construction occupations, as well as the seasonal nature of the work.
Employee benefits comprise an important part of labor costs, covering paid leave, supplemental pay, insurance (health, life, short-term and long-term disability insurance), retirement and savings benefits, legally required benefits (Social Security and Medicare, workers’ compensation, and unemployment insurance), and other benefits such as severance pay. Although costs in construction grew less than in all industries in recent years, total costs in construction were still higher than all industries on average. In December 2015, the largest benefits category was legally required benefits, accounting for nearly 10.5% of total compensation costs in construction, higher than 8.0% for all private industries since construction has higher workers’ compensation and unemployment costs (chart 23c). Paid time off is another major component of benefits for workers, accounting for approximately 23% of the total benefits on average, but around 14% for construction workers. Insurance benefits were also relatively low in construction. For example, insurance benefits were $2.82 per hour for construction workers, but $5.96 per hour for utility workers, who had the highest rate of any industry. This may be partially due to higher unionization rates among utility workers compared to construction workers.2
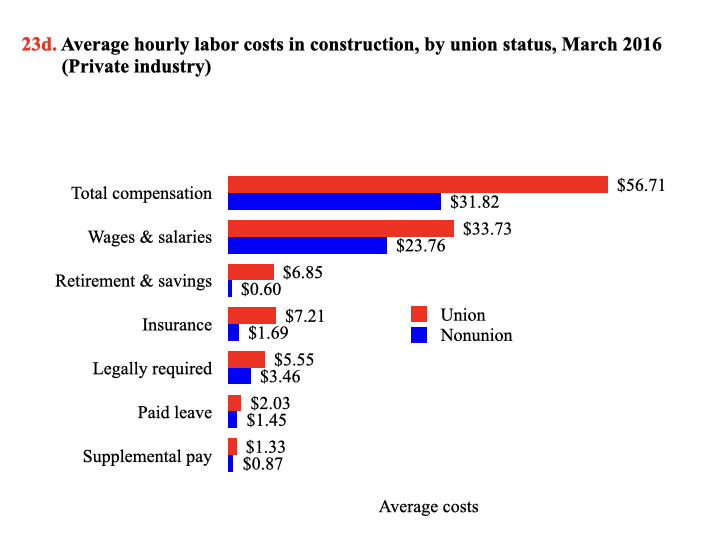
In construction, union members’ total compensation was 78% higher than non-union workers ($56.71 versus $31.82; chart 23d). Wages alone were 42% higher among union workers ($33.73 versus $23.76). The biggest difference between union and non-union construction workers was in retirement and savings ($6.85 versus $0.60) and insurance ($7.21 versus $1.69).
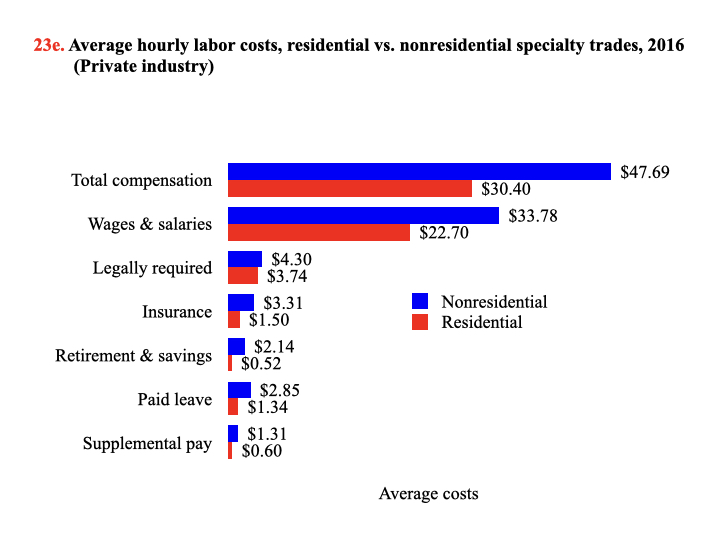
Employment costs also varied among construction subsectors. For example, both wages and benefits for nonresidential workers were much higher than for residential workers.3 While residential workers employed with specialty trade contractors earned $22.70 in wages and salaries, their nonresidential counterparts earned 49% more ($33.78; chart 23e). Nonresidential workers also received more than two times the amount of insurance compared with residential workers ($3.31 versus $1.50). Differences in unionization, establishment size, occupation, and other factors are all associated with these compensation disparities (see pages 26 and 27).
(Click on the image to enlarge or download PowerPoint or PDF versions below.)
Glossary:
Employment Cost Index (ECI) – Part of the National Compensation Survey (NCS), the ECI is an integrated survey program conducted by the U.S. Bureau of Labor Statistics. The ECI is a quarterly index measuring change over time in labor costs. In addition to compensation cost trends, the NCS provides incidence and detailed plan provisions of employee benefit plans. The survey covers nonfarm private industries in addition to state and local government workers. Federal government, agricultural, and self-employed workers are excluded.
1. Employer-paid taxes include Social Security and Medicare taxes that employers are responsible to pay, but do not include other taxes such as income taxes.
2. U.S. Bureau of Labor Statistics. 2017. News release. Union members – 2016. https://www.bls.gov/news.release/pdf/union2.pdf (Accessed February 2017).
3. U.S. Bureau of Labor Statistics. 2016. Office of Compensation and Working Conditions. Compensation Research and Program Development Group. Unpublished data. Contact: Tom Moehrle.
Note:
All charts – Self-employed workers were excluded.
Chart 23b – Wages were reported by employers and adjusted by the Consumer Price Index (CPI) for the 2016 dollar value (CPI Inflation Calculator: https://data.bls.gov/cgi-bin/cpicalc.pl).
Chart 23c – Wages were from a payroll survey reported by employers, defined as hourly straight-time wage rates, including total earnings following payroll deductions, and excluding premium pay for overtime and for work on weekends and holidays, shift differentials, and non-production bonuses such as lump-sum payments instead of wage increases. The asterisk (*) represents a shortened industry title for “Transportation and Warehousing.”
Source:
Chart 23a – U.S. Bureau of Labor Statistics. National Compensation Survey, Employment Cost Index Historical Listing. Table 1: Employment Cost Index for total compensation, by occupational group and industry. http://www.bls.gov/web/eci/echistrynaics.pdf (Accessed February 2017).
Chart 23b – U.S. Bureau of Labor Statistics. 2006-2016 Current Employment Statistics. Calculations by the CPWR Data Center.
Chart 23c – U.S. Bureau of Labor Statistics. 2016. News release. Employer costs for employee compensation – September 2016. http://www.bls.gov/news.release/pdf/ecec.pdf (Accessed February 2017).
Charts 23d and 23e – U.S. Bureau of Labor Statistics. 2016 National Compensation Survey. Unpublished data. Contact: Tom Moehrle.

