Chart Book (6th edition): Employment and Income – Wages in Construction, by Demographic Characteristics, Unionization, and Region
Wages (excluding overtime pay, tips, and commissions) of construction workers vary by demographic characteristics (such as age, gender, race, ethnicity, and education), union status, and region, according to data collected by the Current Population Survey (CPS, see page 10). CPS wage data are collected directly from workers.
Wage differs by union status. In 2015, the average union wage for production workers in construction was $26.56 per hour, 49% higher than the hourly wage for their non-union counterparts ($17.84).1 Union members, on average, are slightly older (see page 14), more educated (see page 29), and more likely to receive apprenticeship training (see page 30) than non-union workers, which may partially contribute to the wage differences.
Wage gaps exist across demographic groups as well. Among production workers (see page 10) in construction, non-white, non-Hispanic (see Glossary) workers had a lower average hourly wage than white, non-Hispanic workers ($17.77 versus $21.39; chart 24a), and Hispanic workers (who can be any race) earned less than either group ($16.70). However, union members had higher than average wages in each demographic. Compared to their non-union counterparts, average hourly union wages were $5.49 higher among non-white, non-Hispanic workers, $7.43 higher among Hispanics, and $8.51 higher among white, non-Hispanics.
Age and educational attainment both exert a large influence on workers’ wages. In general, older workers earn higher wages. In 2015, the average hourly wage of the youngest construction production workers (ages 16-19 years) was $12.38, more than $7 lower than those in the 35-44 age group ($19.91), and more than $10 lower than those in the 55-64 age group ($22.53). This trend holds until age 65, when wages drop considerably (chart 24b). Educational attainment exerts a similar influence on average hourly wage. Workers that did not graduate high school earned almost $4 less per hour ($15.95) than workers with a high school diploma ($19.88), and more than $5 less than those with some college education ($21.32). Workers with at least a bachelor’s degree were paid over $7 more than those with no high school diploma ($23.07), an increase of 45% (chart 24c).
Wages also vary by gender. For production occupations in construction, men earn on average $2.28 more per hour than women. Union status reduces this difference; however, the gender gap is still $1.19 per hour between men and women union members (chart 24d). The wage differential can likely be attributed to the unequal occupational distribution between women and men in construction (see page 19).
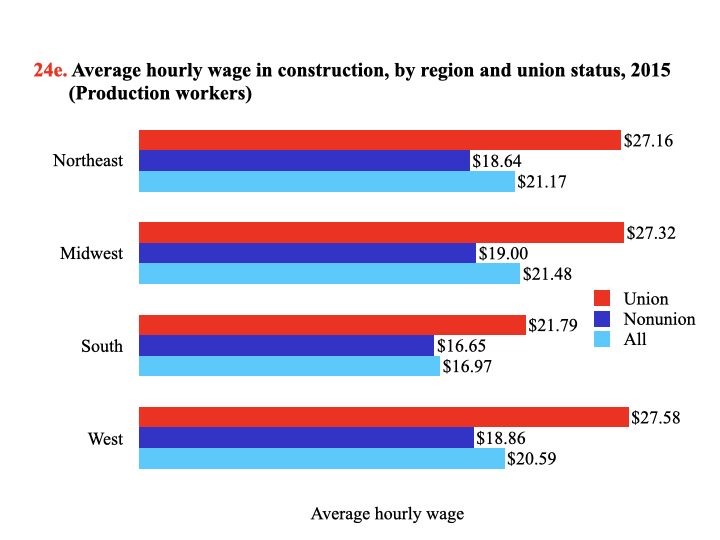
When wages are compared among U.S. regions (see glossary), production workers in construction are found to make less on average in the South than in any other region. The average hourly wage in the South is about 18% lower than in the West, and 20% and 21% less than in the Midwest and the Northeast, respectively (chart 24e). Variations in unionization, age, educational attainment, training, occupation, and diverse ethnic and regional differences, all contribute to wage differentials in the construction industry (see pages 12–19).
(Click on the image to enlarge or download PowerPoint or PDF versions below.)
Glossary:
Non-white, non-Hispanic – From the Current Population Survey and the American Community Survey: those who chose to identify and report themselves in ethnicity as non-Hispanic and in race as black or African American, American Indian or Alaska Native, Asian, Native Hawaiian or Other Pacific Islander, or some race other than white.
Regions – The 50 states and the District of Columbia are divided into regions as follows: Northeast (Connecticut, Maine, Massachusetts, New Hampshire, New Jersey, New York, Pennsylvania, Rhode Island, and Vermont); South (Alabama, Arkansas, Delaware, District of Columbia, Florida, Georgia, Kentucky, Louisiana, Maryland, Mississippi, North Carolina, Oklahoma, South Carolina, Tennessee, Texas, Virginia, and West Virginia); Midwest (Illinois, Indiana, Iowa, Kansas, Michigan, Minnesota, Missouri, Nebraska, North Dakota, Ohio, South Dakota, and Wisconsin); and West (Alaska, Arizona, California, Colorado, Hawaii, Idaho, Montana, Nevada, New Mexico, Oregon, Utah, Washington, and Wyoming).
1. All numbers on this page were estimated using data from the Current Population Survey. Calculations by the CPWR Data Center.
Note:
All charts – Production workers are blue-collar workers; all workers except managerial, professional (architects, accountants, etc.), and administrative support staff. Data include all hourly wage earners who reported their pay on an hourly basis and whose wages were greater than zero. Self-employed workers were excluded.
Chart 24a – The minimum sample size was 109; standard errors of wages were within ± 5%; ranges between upper and lower levels (95% CI) were within $4.30; p-value < 0.001.
Chart 24b – The minimum sample size was 121 for the 65+ age group; standard errors of wages were within ± 5%; ranges between upper and lower levels (95% CI) were within $2.50; p-value < 0.001.
Chart 24c – The minimum sample size was 262 for the bachelor’s and above education group; standard errors of wages were within ± 5%; ranges between upper and lower levels (95% CI) were within $2.50; p-value < 0.001.
Chart 24d – Wages were averaged across three years (2013–2015) in 2015 dollars; wages in 2013 and 2014 were adjusted using the Urban Wage Consumer Price Index (CPI-W, see Annex). The minimum sample size was 57; standard errors of wages were within ± 5%; ranges between upper and lower levels (95% CI) were within $5.50; p-value < 0.001.
Chart 24e –– The minimum sample size was 150, standard errors of wages were within ± 3%; ranges between upper and lower levels (95% CI) were within $3.20; p-value < 0.001.
Source:
Charts 24a-24c, and 24e – U.S. Bureau of Labor Statistics. 2015 Current Population Survey. Calculations by the CPWR Data Center.
Chart 24d – U.S. Bureau of Labor Statistics. 2013-2015 Current Population Survey. Calculations by the CPWR Data Center.
