Chart Book (6th edition): Industry Summary – Characteristics of Construction Businesses
8. Characteristics of Construction Businesses
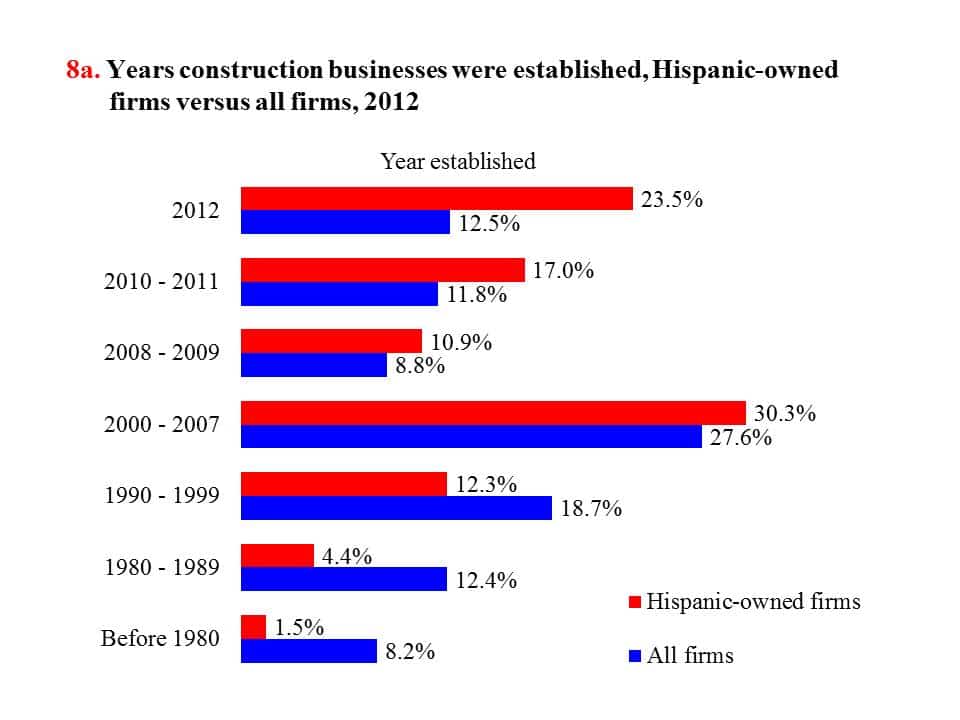
Construction businesses are highly diverse, and range widely with regard to business age, sources of capital, type of ownership, worker composition, and other factors.1 Hispanic-owned firms (see page 7) and nonemployer (see page 3) firms in construction are younger than all construction firms on average. Between 2008 and 2012, about one-third of construction firms (33.1%) were established while more than half (51.4%) of Hispanic-owned construction firms were established during the same period (chart 8a).2 Around 24% of Hispanic-owned firms were established in the year 2012 alone, nearly twice the proportion of all construction firms (12.5%) established that year. The majority of these Hispanic-owned firms were classified as nonemployer businesses.1
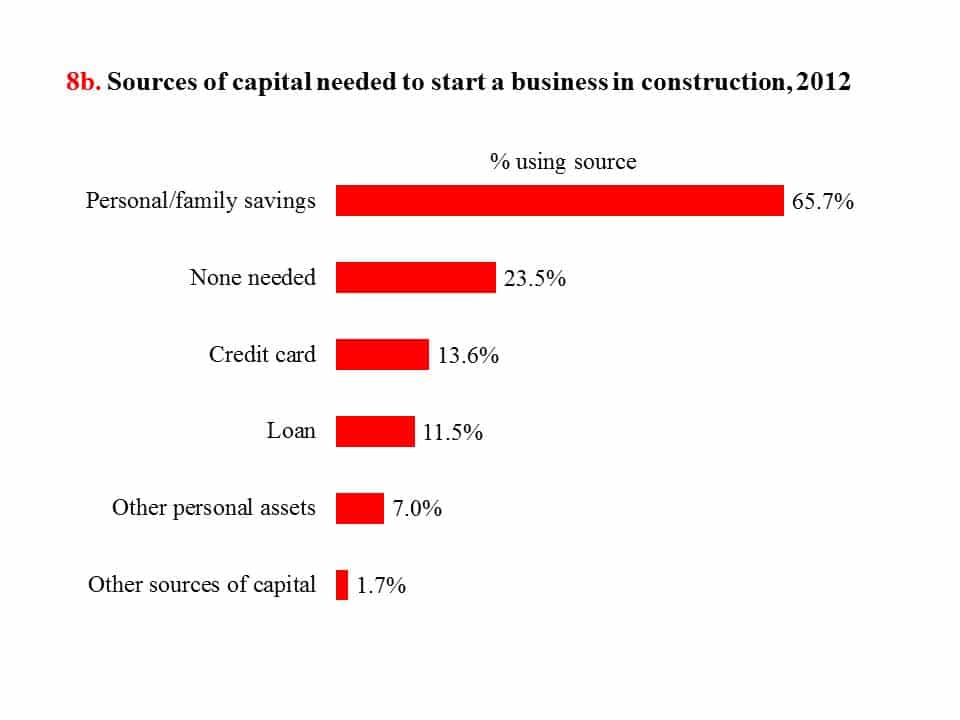
In 2012, the most common source of capital to start a construction firm was owners’ personal/family savings (chart 8b). Although more than one source of capital could be used, two out of three (66%) owners reported starting their businesses with personal savings. Other common sources included credit cards, loans, and other personal assets. However, 23.5% of construction owners reported that they did not need any money to start their businesses. In addition, nonemployer firms needed less capital amounts to start than employer firms.1
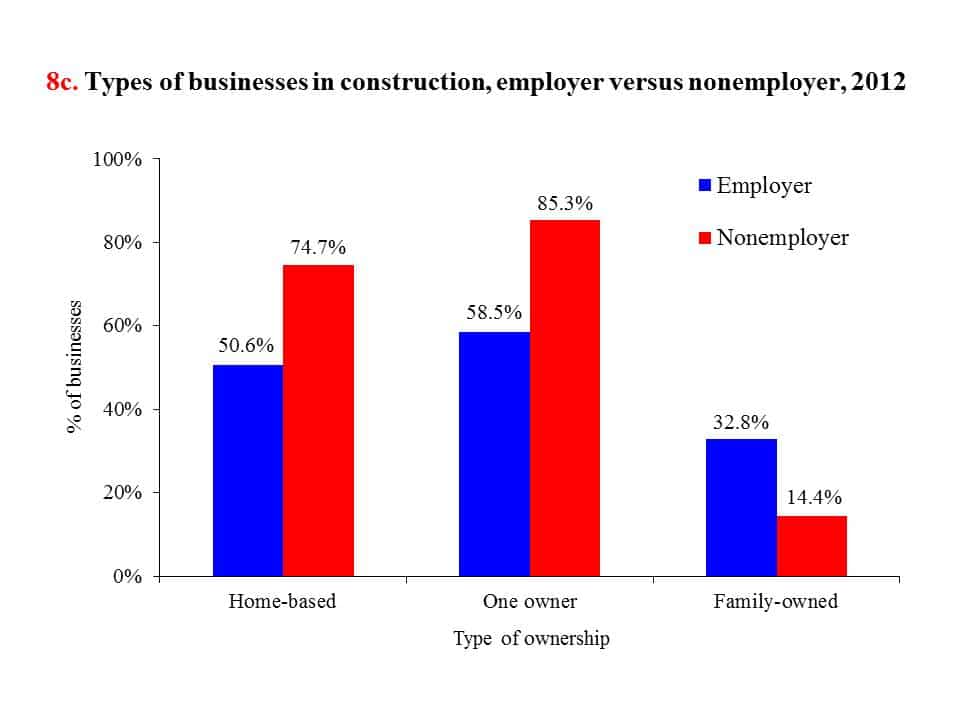
Nearly 70% of construction firms operated from home in 2012, higher than 52% for all industries combined.1 Within construction, nonemployer firms were more likely than employer firms to be home-based (74.7% versus 50.6%). More than half (58.5%) of employer firms had one owner, compared with 85.3% for nonemployer firms (chart 8c).
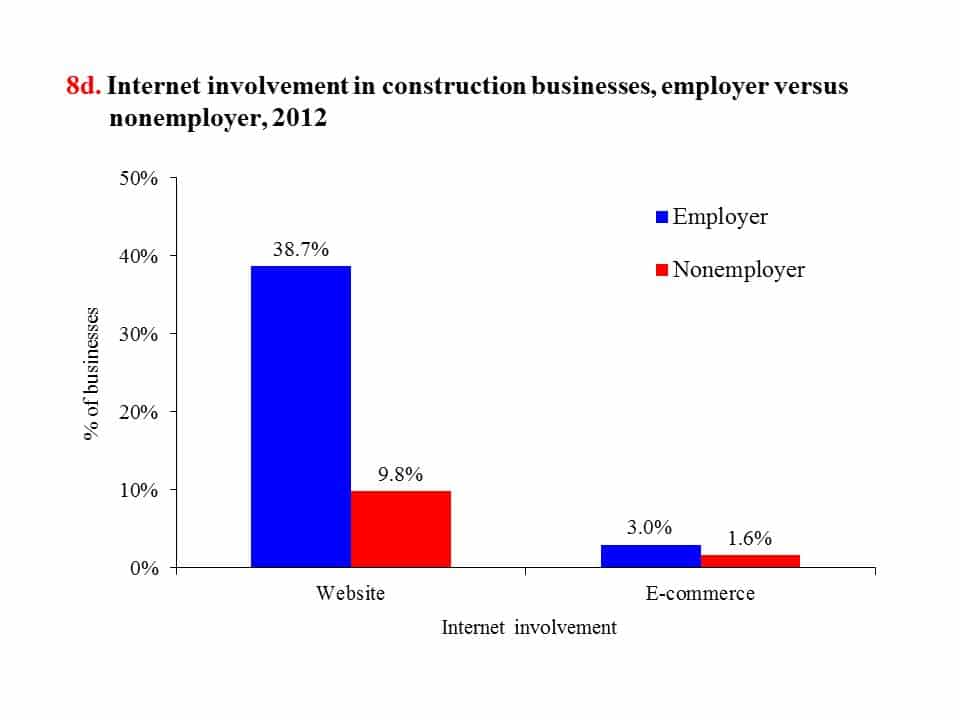
Among employer firms in construction, 38.7% had a company website and 3.0% engaged in e-commerce in 2012 (chart 8d). In contrast, only one in ten (9.8%) nonemployer firms had a website and 1.6% were involved in e-commerce.
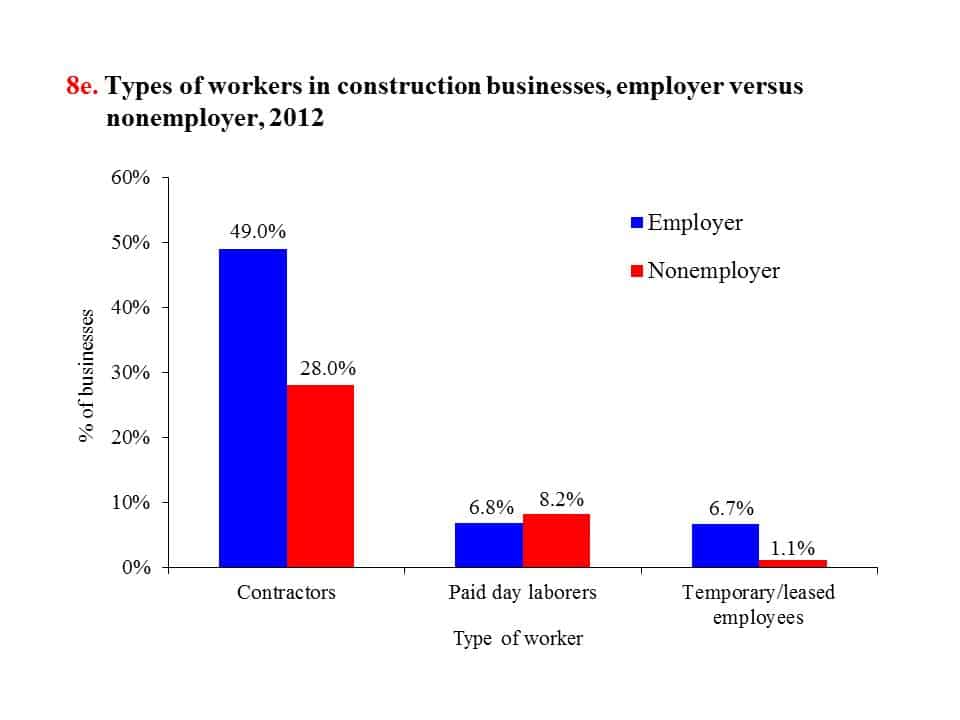
In terms of types of workers, nearly half (49.0%) of employer firms and 28.0% of nonemployer firms used contractors, subcontractors, independent contractors, or outside consultants (chart 8e). Use of alternative types of workers reflects the varied categories of work, skills, and degree of specialization in the construction industry.
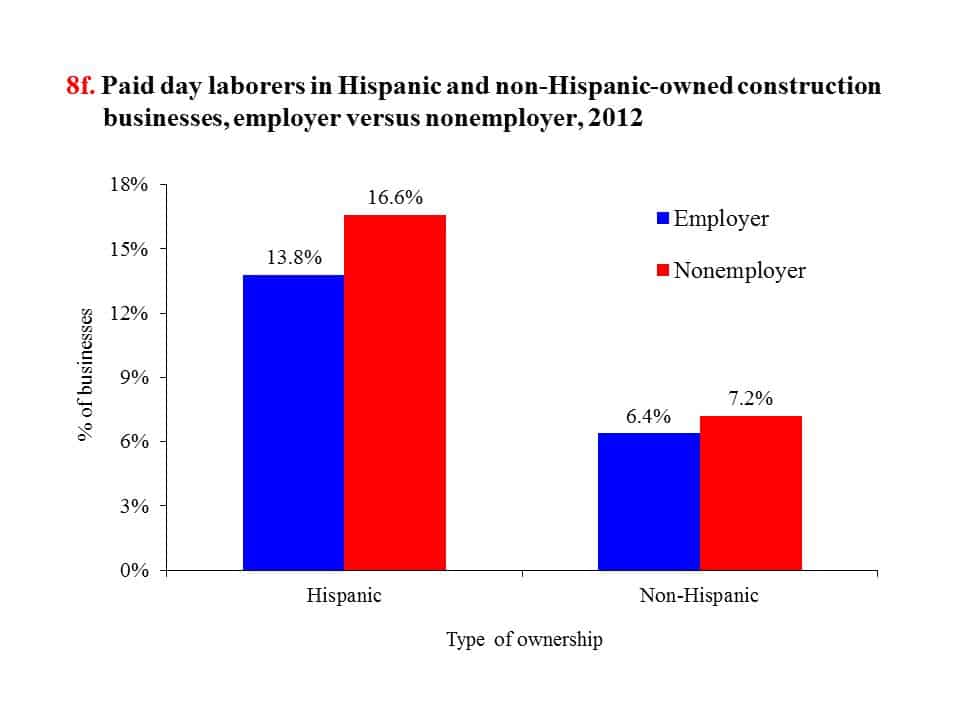
Day laborers (see Glossary) make up an important segment of the construction workforce; Hispanic-owned construction firms were more likely to use day laborers than non-Hispanic-owned firms (chart 8f). About 8% of construction firms used day laborers, 29% of employer firms had no full-time employees on their payroll, and 5% hired temporary workers through temporary help services.1
(Click on the image to enlarge or download PowerPoint or PDF versions below.)
Glossary:
Day laborers – Workers hired and paid one day at a time. Day laborers find work through two common routes. First, some employment agencies specialize in short-term contracts for manual labor in construction, factories, offices, and manufacturing. These companies usually have offices where workers can arrive and be assigned to a job on the spot, as they are available. Less formally, workers meet at well-known locations, usually public street corners or commercial parking lots, and wait for building contractors, landscapers, home owners, small business owners, and other potential employers to offer work. Much of this work is in small residential construction or landscaping. It is believed that day laborers commonly receive payment in cash, which allows them to evade income taxes.
Nonemployer – From the Census Bureau: a business with no payroll or paid employees, with annual business receipts of $1,000 or more ($1 or more in the construction industry), and subject to federal income taxes. Most nonemployer firms are very small unincorporated businesses operated by self-employed individuals. Nonemployer firms can be partnerships, sole proprietorships, or corporations without employees.
1. U.S. Census Bureau. 2012 Economic Census. Survey of Business Owners (SBO). https://www.census.gov/programs-surveys/sbo.html (Accessed March 2016). Firms not responding to the 2012 SBO survey questions and those that did not know the answers to questions were excluded from the percentages reported in the text. The categories and data used on this page are not directly comparable to other pages and previous editions of this chart book due to changes in coding systems and divergent survey methodologies.
2. About 40% of U.S. firms were established between 2008 and 2012.
Note:
Chart 8a – Firms without related information were excluded from the distributions.
Chart 8b – “Loans” include business loans from federal, state, or local governments, banks, and financial institutions; government-guaranteed business loans from banks or financial institutions; and business loans and investments from family and friends. More than one source may have been used, therefore the percentages will not add to 100%.
Chart 8d – “E-commerce” is the sale of goods and services where the buyer places an order, or the price and terms of the sale are negotiated, over an Electronic Data Interchange, the Internet, or any other online system (extranet, e-mail, instant messaging). Payment may or may not be made online.
Chart 8e – “Contractors” include contractors, subcontractors, independent contractors, and outside consultants.
Source:
Chart 8a – U.S. Census Bureau. 2012 Economic Census. Survey of Business Owners. (SB1200CSCB10) https://www.census.gov/programs-surveys/sbo.html (Accessed February 2017).
Charts 8b-8f – U.S. Census Bureau. 2012 Economic Census. Survey of Business Owners. https://www.census.gov/programs-surveys/sbo.html (Accessed March 2016).
