Chart Book (6th edition): Industry Summary – Construction Spending: Private and Public Sector
5. Construction Spending: Private and Public Sector
Construction spending (formerly known as the value of construction put in place) is collected in a monthly survey that has been conducted by the U.S. Census Bureau since 1960.1 Information on ownership (private or government, state, local, and federal level) and type of construction projects (for example, residential, commercial, or highways and streets) are collected by the survey. In 2015, the annual value of construction was $1.12 trillion, a 26% increase since 2010 after adjusting for inflation, but still lower than the 2006 peak of $1.35 trillion.2,3,4
Private construction is categorized as residential (see page 6) or nonresidential. Nonresidential construction is further categorized to include power facilities, commercial, manufacturing, and health care. Public construction consists primarily of educational, highways and streets, transportation, sewage and waste disposal, conservation and development, and water supply.
After adjusting to 2015 dollars, the value of private construction climbed to $1,056 billion in 2005, declined to $534 billion in 2011, and rose again to $824 billion in 2015 (chart 5a). By contrast, the value of public construction increased modestly during this period, with a minor decline beginning in 2010. By 2015, public construction spending was close to 2006 levels when inflation was taken into consideration. The ratio of private to public construction sectors also fluctuated over time, from a ratio of 3.8:1 in 2005 down to a ratio of 1.7:1 in 2010, and then up to 2.9:1 in 2015, indicating that the impact of the Great Recession was greater for private construction than for public construction.
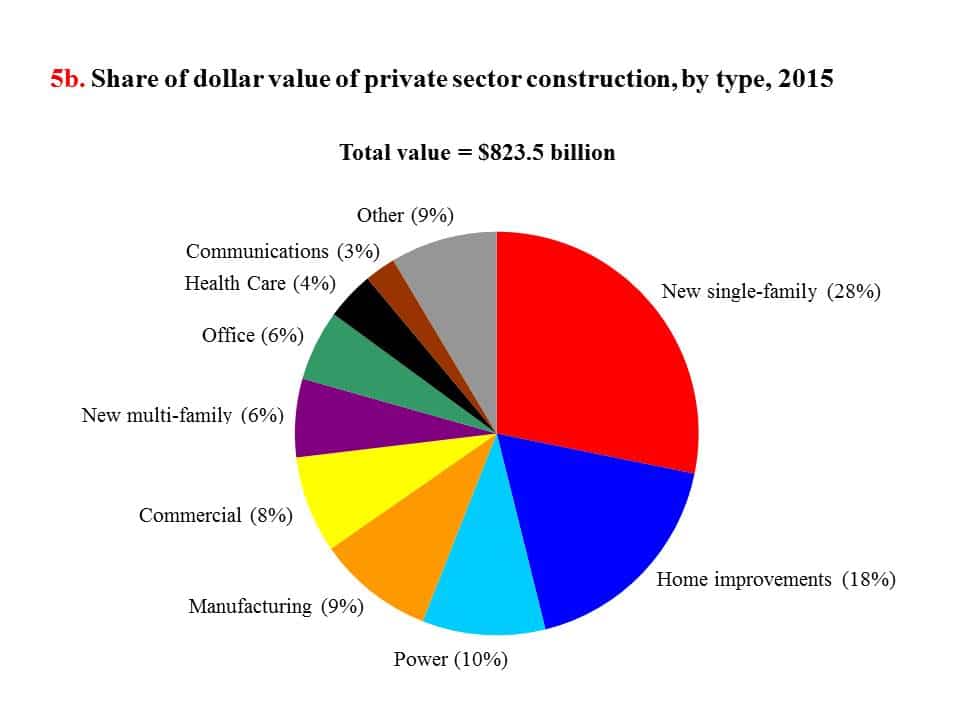
Within private construction, new single-family buildings and home improvements were the two largest types, accounting for about 46% of the total value in 2015 (chart 5b). The value of new single-family buildings rose from 22% in 2010 to 28% in 2015; meanwhile, the proportion of home improvements (see page 6) fell slightly from 23% to 18%.1
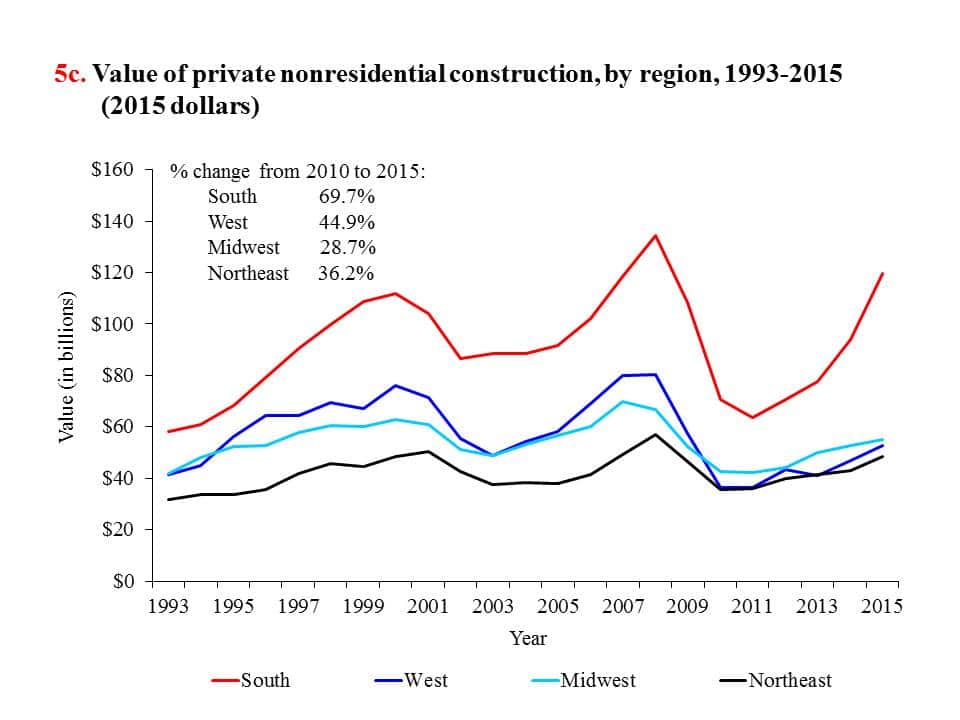
Geographically, privately-owned nonresidential construction grew in all four regions (see Glossary) in the mid-2000s, and then sharply declined between 2008 and 2010. Private nonresidential construction then grew again in all four regions from 2011 to 2015 (chart 5c). 3 The greatest percentage gain was reported in the South, where the value of nonresidential construction rose by 69.7% from 2010 to 2015. The South also had the highest share among all regions, accounting for 43% of the total value of non-residential construction in the U.S. in 2015.
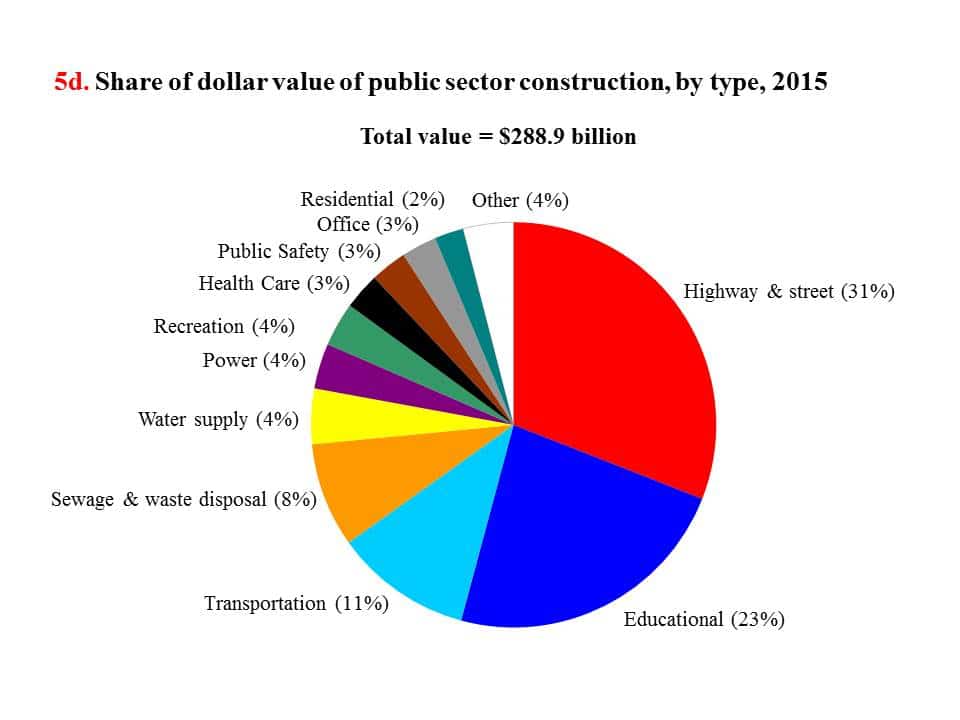
Highway and street construction accounted for the largest share of the dollar value of public spending at $89.4 billion (or 31%) in 2015 (chart 5d). Construction of educational facilities was the second largest at $66.6 billion, encompassing 23% of public construction.
(Click on the image to enlarge or download PowerPoint or PDF versions below.)
Glossary:
Regions – The 50 states and the District of Columbia are divided into regions as follows: Northeast (Connecticut, Maine, Massachusetts, New Hampshire, New Jersey, New York, Pennsylvania, Rhode Island, and Vermont); South (Alabama, Arkansas, Delaware, District of Columbia, Florida, Georgia, Kentucky, Louisiana, Maryland, Mississippi, North Carolina, Oklahoma, South Carolina, Tennessee, Texas, Virginia, and West Virginia); Midwest (Illinois, Indiana, Iowa, Kansas, Michigan, Minnesota, Missouri, Nebraska, North Dakota, Ohio, South Dakota, and Wisconsin); and West (Alaska, Arizona, California, Colorado, Hawaii, Idaho, Montana, Nevada, New Mexico, Oregon, Utah, Washington, and Wyoming).
1. U.S. Census Bureau. Construction Spending: Overview. http://www.census.gov/construction/c30/c30index.html (Accessed January 2017). Construction spending includes: 1) materials installed or erected, 2) labor, 3) construction rental equipment, 4) the contractor’s profit, 5) architectural and engineering work, 6) miscellaneous overhead and office costs chargeable to the project on the owner’s books, and 7) interest and taxes paid during construction (except state and locally-owned projects).
2. U.S. Census Bureau. Historical Annual Value of Construction Put in Place series. https://www.census.gov/construction/c30/xls/total.xls (Accessed January 2017).
3. Dollar values were adjusted for inflation.
4. Variations in the values reported for construction result from differing survey and estimation methods. The Value of Construction Put in Place measures the value of a project from the project owner’s perspective and includes all construction expenditures in a given period regardless of who worked on the projects. In contrast, the Economic Census is based on the receipts and expenditures of establishments performing the construction work.
Note:
Chart 5a – According to the Value of Construction Put in Place series, public and private construction totaled $1.12 trillion. The Gross Domestic Product Implicit Price Deflator was used to adjust current dollar value to 2015 dollars.
Chart 5b – “Other” private construction includes lodging, educational, religious, public safety, amusement and recreation, transportation, sewage and waste disposal, and water supply. Total may not add to 100% due to rounding.
Chart 5c – Private nonresidential construction by region excludes power, communications, and railroad work. The Gross Domestic Product Implicit Price Deflator was used to adjust current dollar value to 2015 dollars.
Chart 5d – “Other” public construction includes conservation and development, as well as commercial spending. Total may not add to 100% due to rounding.
Source:
Chart 5a – U.S. Census Bureau. Annual Value of Construction Put in Place series. http://www.census.gov/construction/c30/historical_data.html and http://www.census.gov/construction/c30/pdf/totalha.pdf (Accessed January 2017).
U.S. Bureau of Economic Analysis, Gross Domestic Product: Implicit Price Deflator [GDPDEF], retrieved from FRED, Federal Reserve Bank of St. Louis; https://fred.stlouisfed.org/series/GDPDEF (AccessedFebruary 2017).
Chart 5b – U.S. Census Bureau. Annual Value of Construction Put in Place private series. http://www.census.gov/construction/c30/xls/private.xls (Accessed January 2017).
Chart 5c – U.S. Census Bureau. Annual Value of Private Nonresidential Construction Put in Place by region, for selected types of construction. http://www.census.gov/construction/c30/pdf/region.pdf (Accessed January 2017). U.S. Bureau of Economic Analysis, Gross Domestic Product: Implicit Price Deflator [GDPDEF], retrieved from FRED, Federal Reserve Bank of St. Louis; https://fred.stlouisfed.org/series/GDPDEF (AccessedFebruary 2017). Chart 5d – U.S. Census Bureau. Annual Value of Construction Put in Place public series. http://www.census.gov/construction/c30/xls/public.xls (Accessed January 2017).


