Chart Book (6th edition): Labor Force Characteristics – Union Membership and Coverage in Construction and Other Industries
In 2016, nearly 1.2 million (1,150,000) construction workers were union members, an increase of 100,000 from 2015 (1,050,000). About 1,039,000 union members in construction worked for private companies, and the remaining 111,000 were government (federal, state, and local government) employees.1 An additional 62,900 construction workers who were not union members were covered by union contracts.
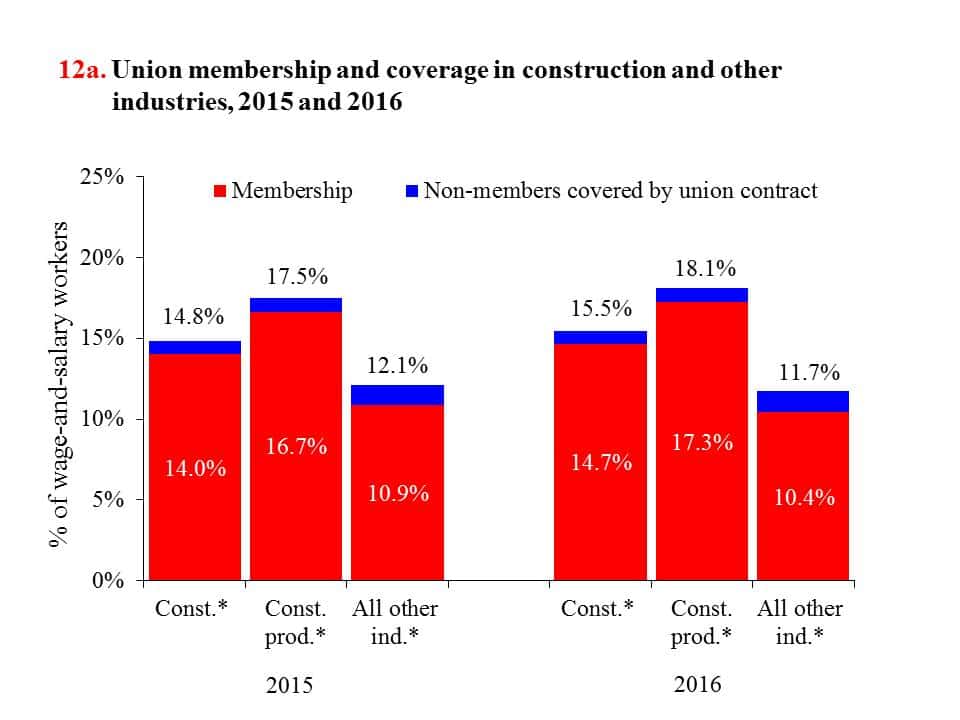
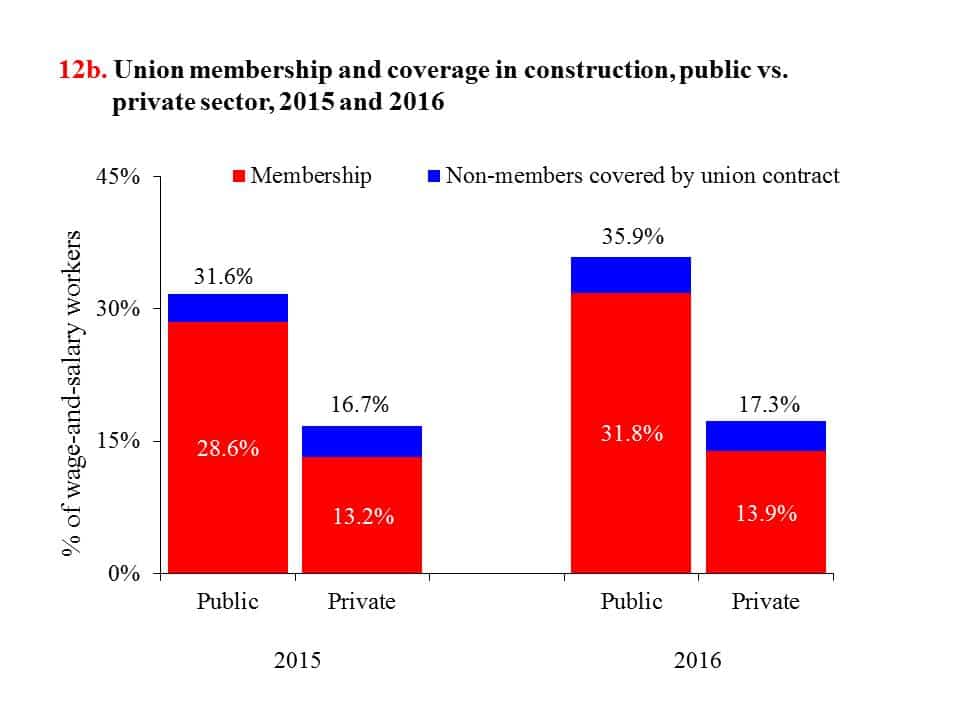
Overall, the construction industry in 2016 had a higher rate of union representation2 than all other industries combined (15.5% versus 11.7%; chart 12a), including less than 1% of construction workers who reported no union affiliation but were covered by a union contract. Unionization is more common among production (blue-collar, see Glossary) occupations, with 18.1% union representation for construction in 2016. Moreover, the union membership rate among construction workers employed in government was more than double that of those who worked for private construction companies (31.8% versus 13.9%; chart 12b).
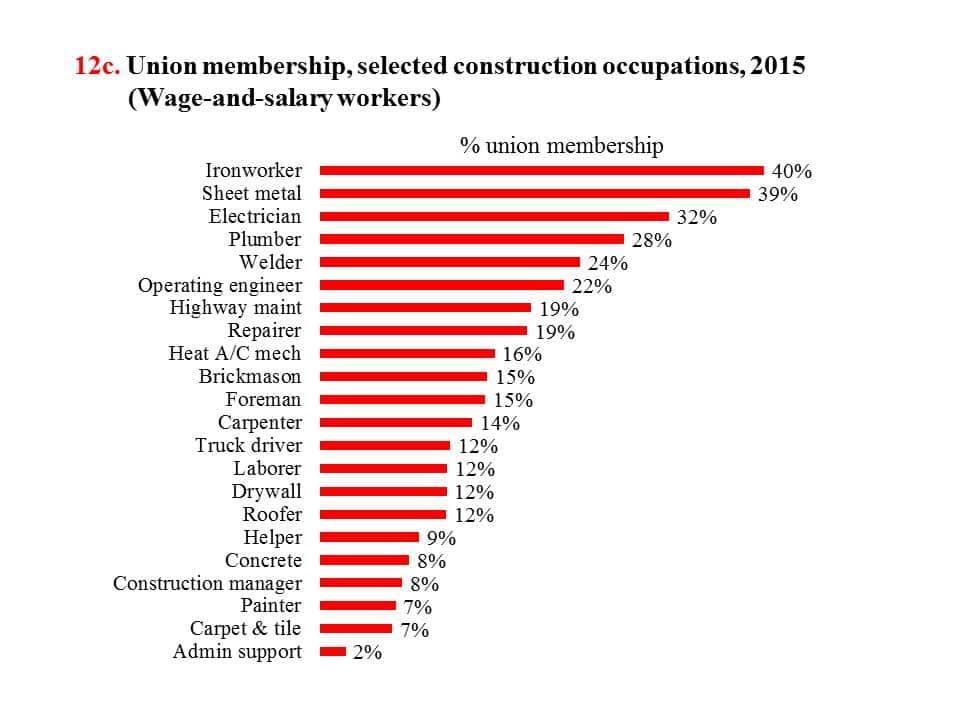
Union membership varies among construction occupations. In 2015, 40% of ironworkers and 39% of sheet metal workers were union members, while the rate of union membership was only 7% among painters and carpet and tile workers (chart 12c).
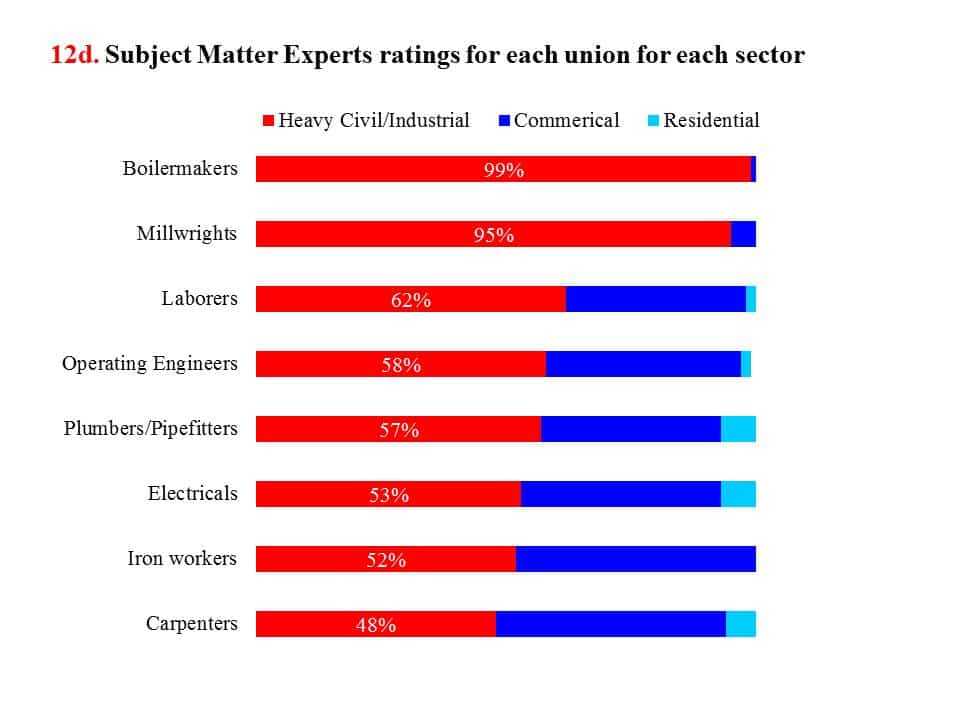
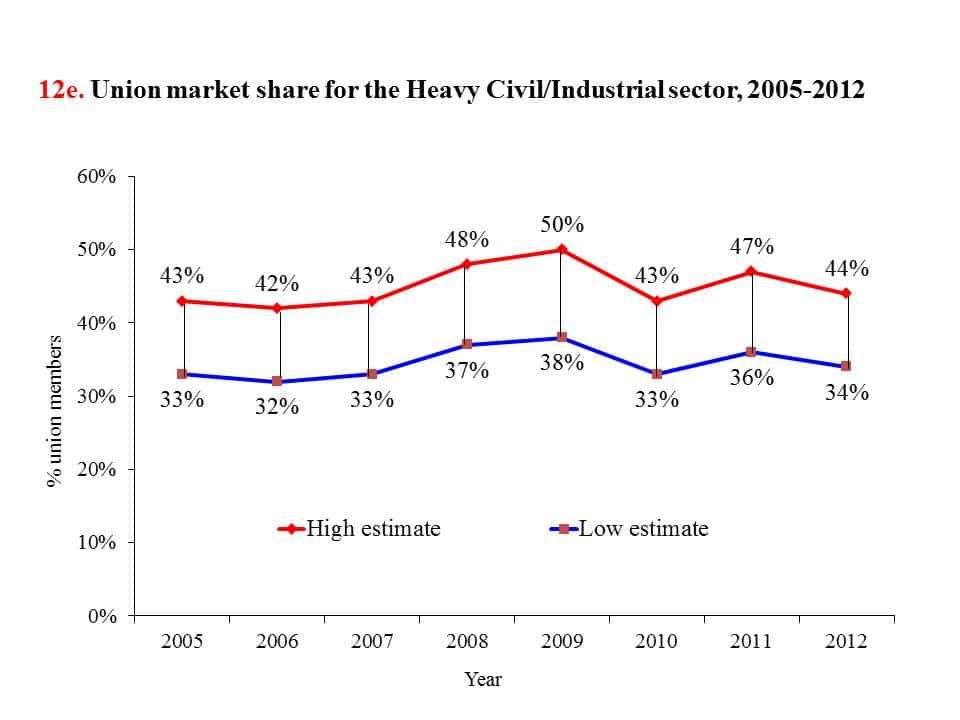
Union membership is also distributed differently by construction subsector. According to the rates estimated by the Subject Matter Experts (SMEs),3 very few union members were employed in residential construction. In contrast, among union members who were boilermakers, almost all (99%) worked in the Heavy Civil/Industrial sector (chart 12d). As a result, estimated union market share (see Glossary) in this sector ranged as high as 42% to 50% between 2005 and 2012 (chart 12e), significantly higher than that for overall construction on average.
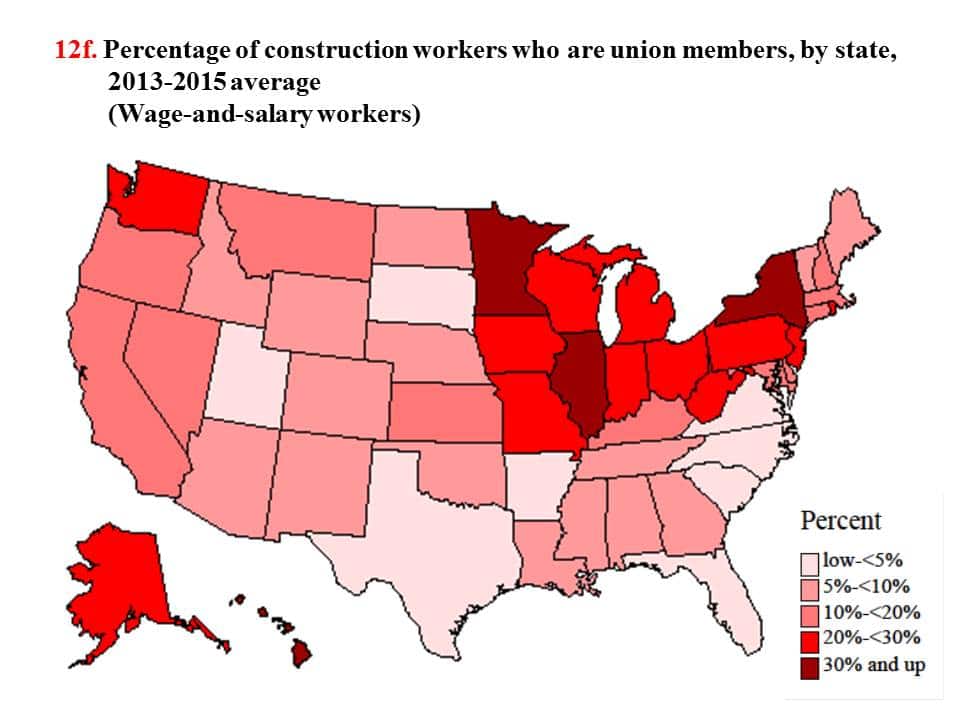
Geographically, four states had an annual union membership rate of more than 30% from 2013 to 2015 (chart 12e). These states, listed in decreasing order, were Hawaii, Illinois, New York, and Minnesota. The five states with the lowest union membership rates, listed in ascending order, were North Carolina, South Carolina, Arkansas, Texas, and Florida.
Unionization estimates from the CPS were based on two questions. The CPS asks wage-and-salary employees (see Glossary, self-employed workers are excluded from this question) if they are a member of a labor union or an employee association similar to a union. Respondents who answer “no” are asked if they are covered by a union or employee association contract. The numbers in construction reported on this page include both private and government employees. Therefore, the tabulations may vary from the publications of the U.S. Bureau of Labor Statistics, which typically reports union membership by industry for the private sector only (or not including government employees).4 Since the construction industry is coded as a single category in the CPS, union membership/market share in construction subsectors was estimated indirectly.
(Click on the image to enlarge or download PowerPoint or PDF versions below.)
Glossary:
Production workers – In this chart book, same as blue-collar workers. From the Current Population Survey: all workers, except managerial, professional (architects, accountants, lawyers, etc.), and administrative support staff. Production workers can be either wage-and-salary or self-employed workers.
Wage-and-salary – Workers who receive wages, salaries, commissions, tips, or pay from a private employer or from a government unit.
Union market share – Proportion of union workers (mainly in production occupations) in a given segment of an industry; similar to union membership defined by the Current Population Survey.
1. U.S. Bureau of Labor Statistics. 2015 and 2016 Current Population Survey. Calculations by the CPWR Data Center.
2. According to the BLS definition, this group includes both union members and workers who report no union affiliation but whose jobs are covered by a union contract.
3. Subject Matter Experts (SMEs) are individuals with extensive experience in, and/or substantial knowledge of, union construction work. The SMEs represent three categories: management, unions, and other.
4. U.S. Bureau of Labor Statistics. 2017. News Release: Union Members – 2016. http://www.bls.gov/news.release/pdf/union2.pdf (Accessed February 2017).
Note:
Chart 12a—Terms marked with an asterisk (*) were shortened for space as follows: Const.= construction; prod.= production; ind.= industry.
Charts 12a and 12b – Production (or blue collar) occupations, as distinguished from managerial and support staff, are listed as 6200-9750 in the Current Population Survey (see page 11).
Chart 12c – These figures do not reflect total membership in any given union, which may include more than one occupation. The reported occupations are based on the sample size used for the estimates, not based on the union membership rates. The sample size of some occupations (such as boilermakers and elevator installers) are too small to be reported, though these occupations may have a higher union membership rate. Therefore, only selected occupations are reported.
Chart 12d – Numbers are based on assessments from the Subject Matter Experts.
Chart 12e – According to Market Share Analysis by the Construction Labor Research Council, union market share (or union membership) data for each craft/occupation in construction were acquired from the Current Population Survey. The distribution of the union workforce by construction sector for each craft/occupation (as determined by the SMEs) and the proportion of each sector among the total construction workforce (based on the Economic Census) were factored together for the estimates according to the formula X * Y/Z, where: X = CPS market share results; Y = SME results for unions for heavy civil/industrial; and Z = Economic Census results for total industry for heavy civil/industrial.
Chart 12f – Data from three years were pooled together for more reliable estimates at the state level.
Source:
Charts 12a and 12b –U.S. Bureau of Labor Statistics. 2015 and 2016 Current Population Survey. Calculations by the CPWR Data Center.
Chart 12c – U.S. Bureau of Labor Statistics. 2015 Current Population Survey. Calculations by the CPWR Data Center.
Charts 12d and 12e – Construction Labor Research Council. 2014. Market Share Analysis. Unpublished data.
Chart 12f – U.S. Bureau of Labor Statistics. 2013-2015 Current Population Survey. Calculations by the CPWR Data Center.
